Interactivity is one of Tableau’s greatest strengths, and using filters to alter the information that your visualisation shows is a great quality, but what if we want to keep one or more dimensions the same while we slice through the rest of our data?
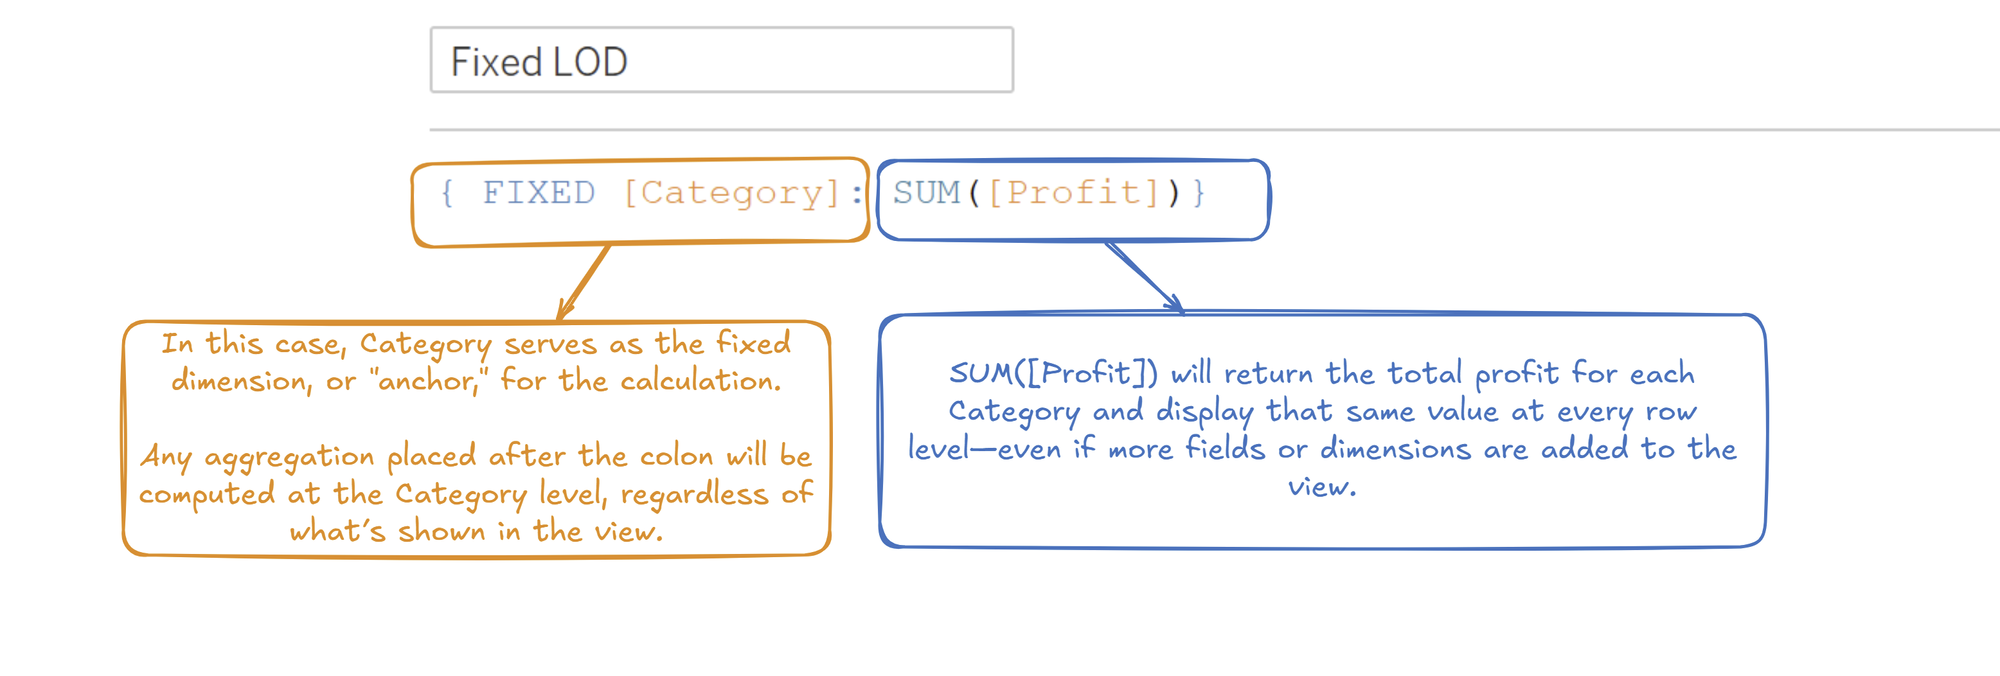
I imagine the calculation a bit like an anchor, once it’s laid down in your table it will stay still even while things around it change.
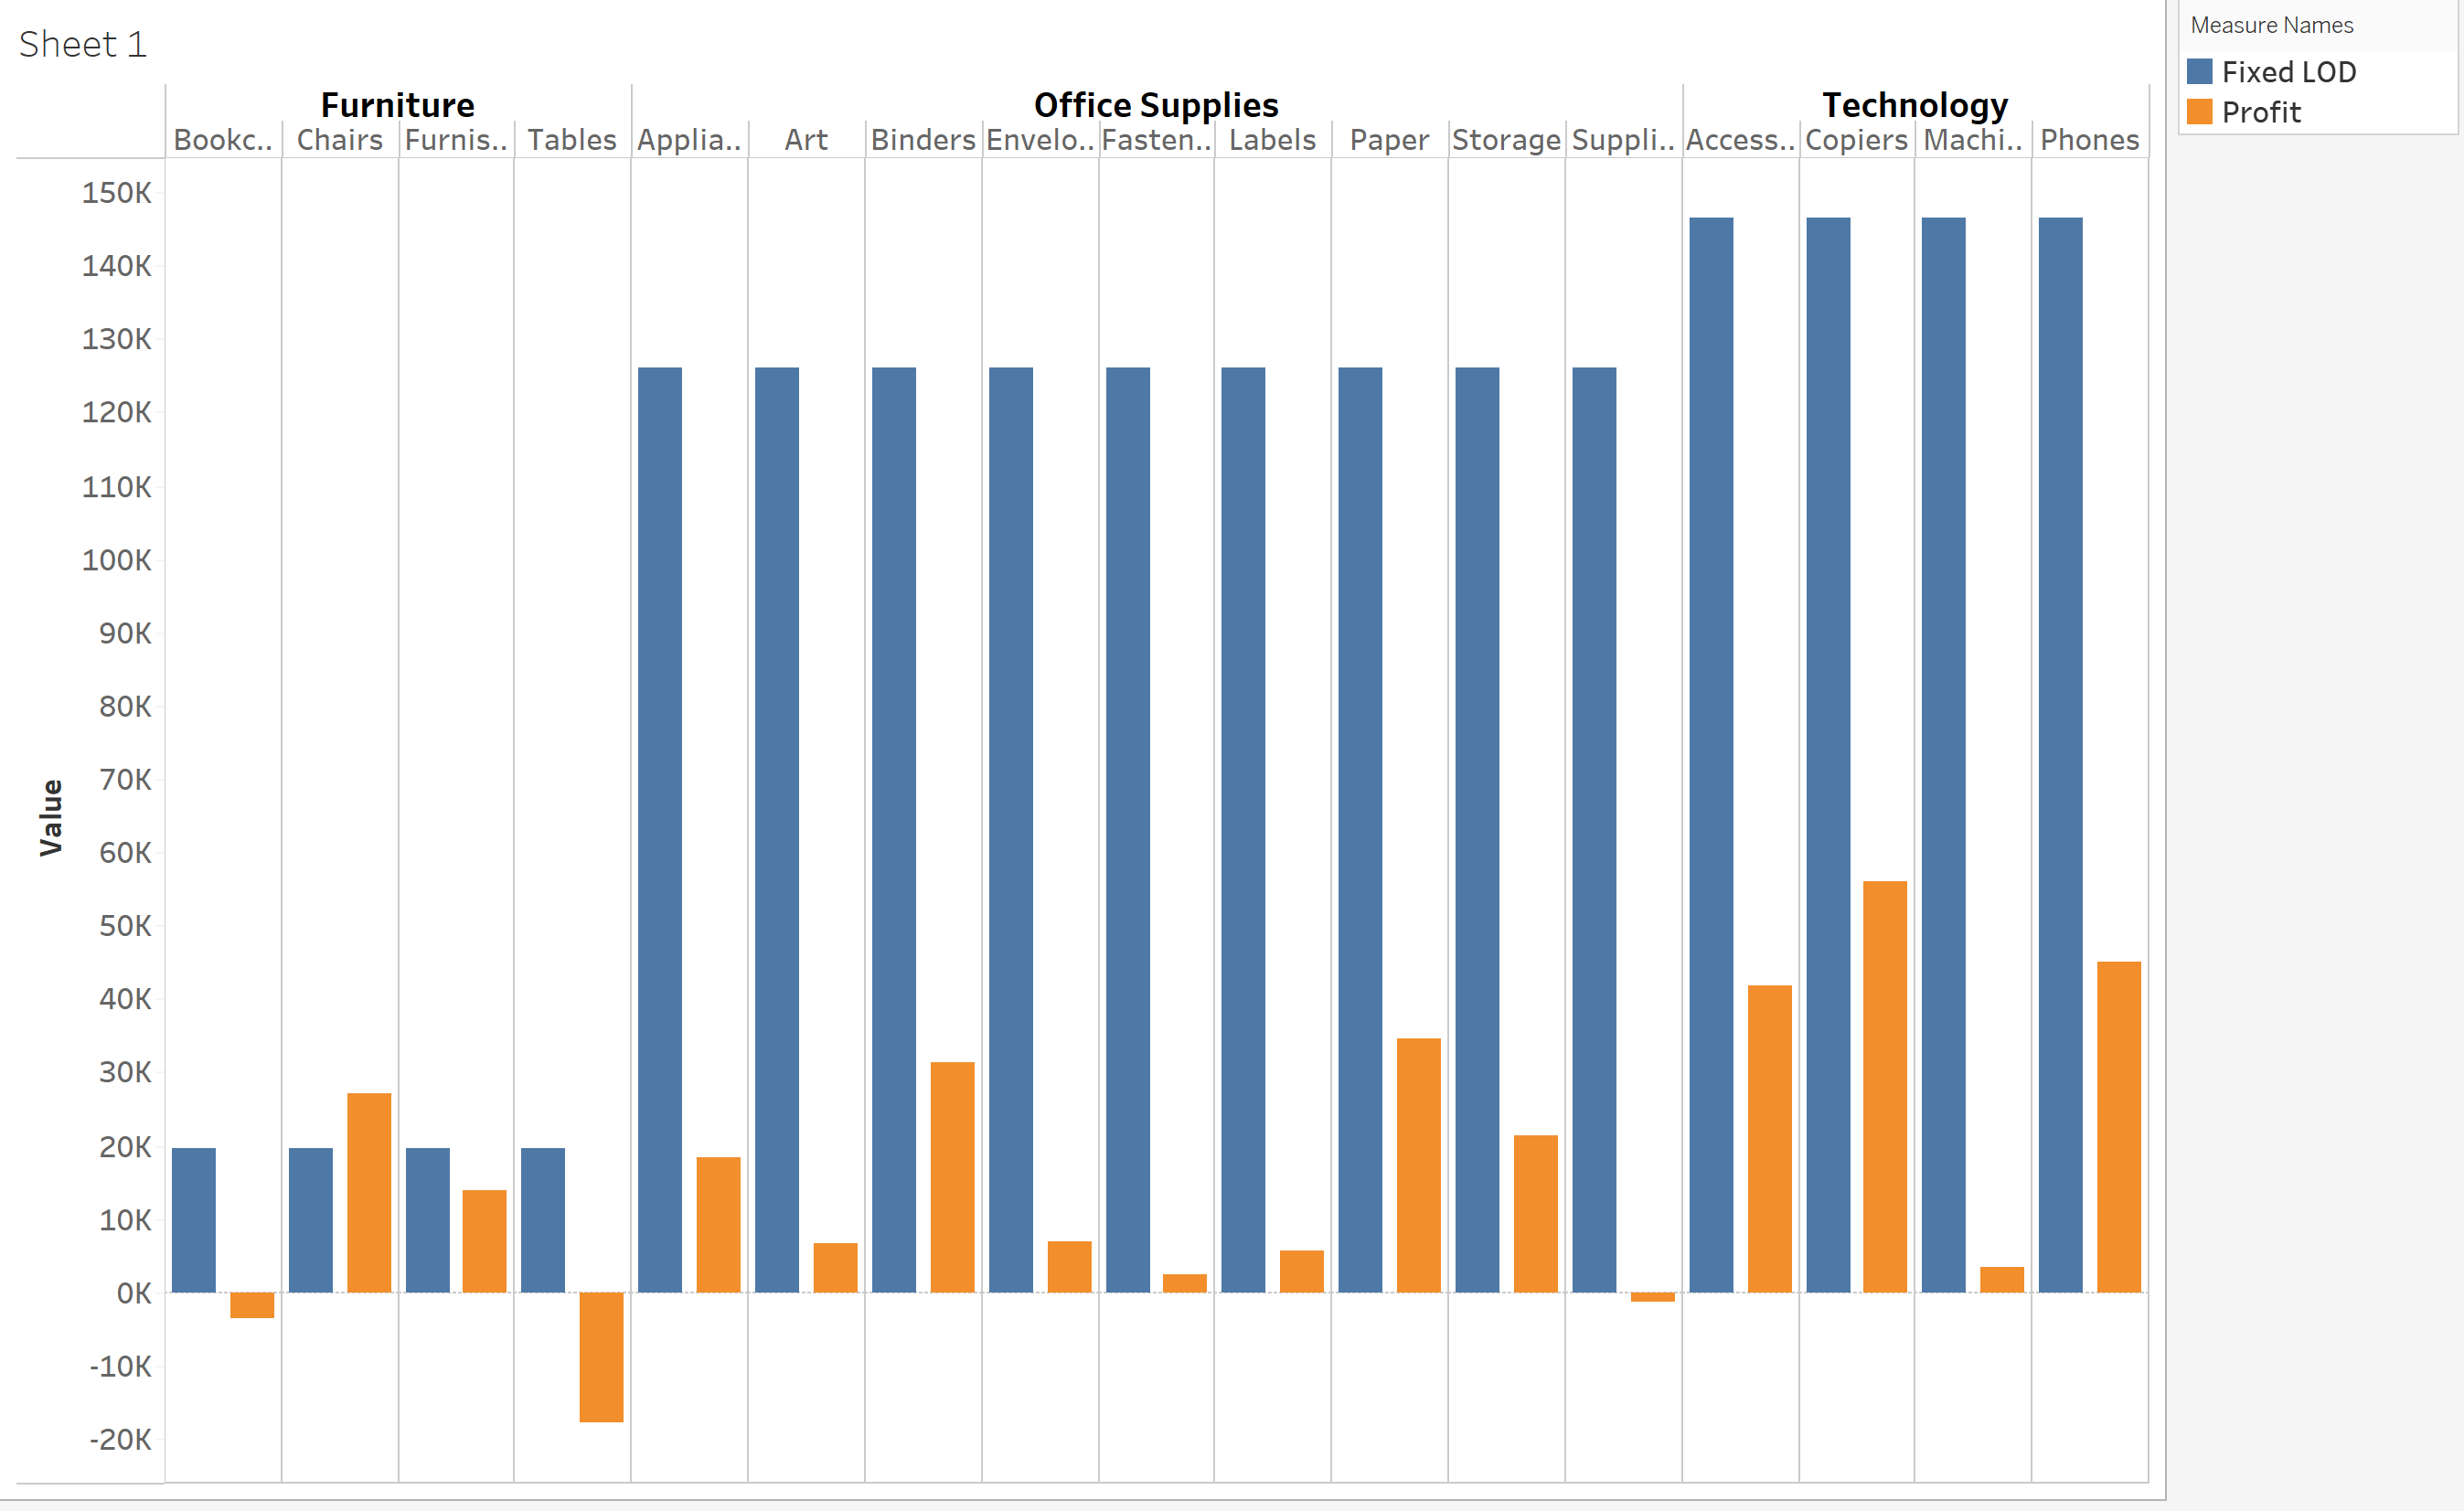
Take this example using the Superstore sample data in Tableau:
FIXED Level of Detail calculations are especially powerful in scenarios where we want to compare individual records to higher-level aggregated values—such as totals, averages, or ranks.
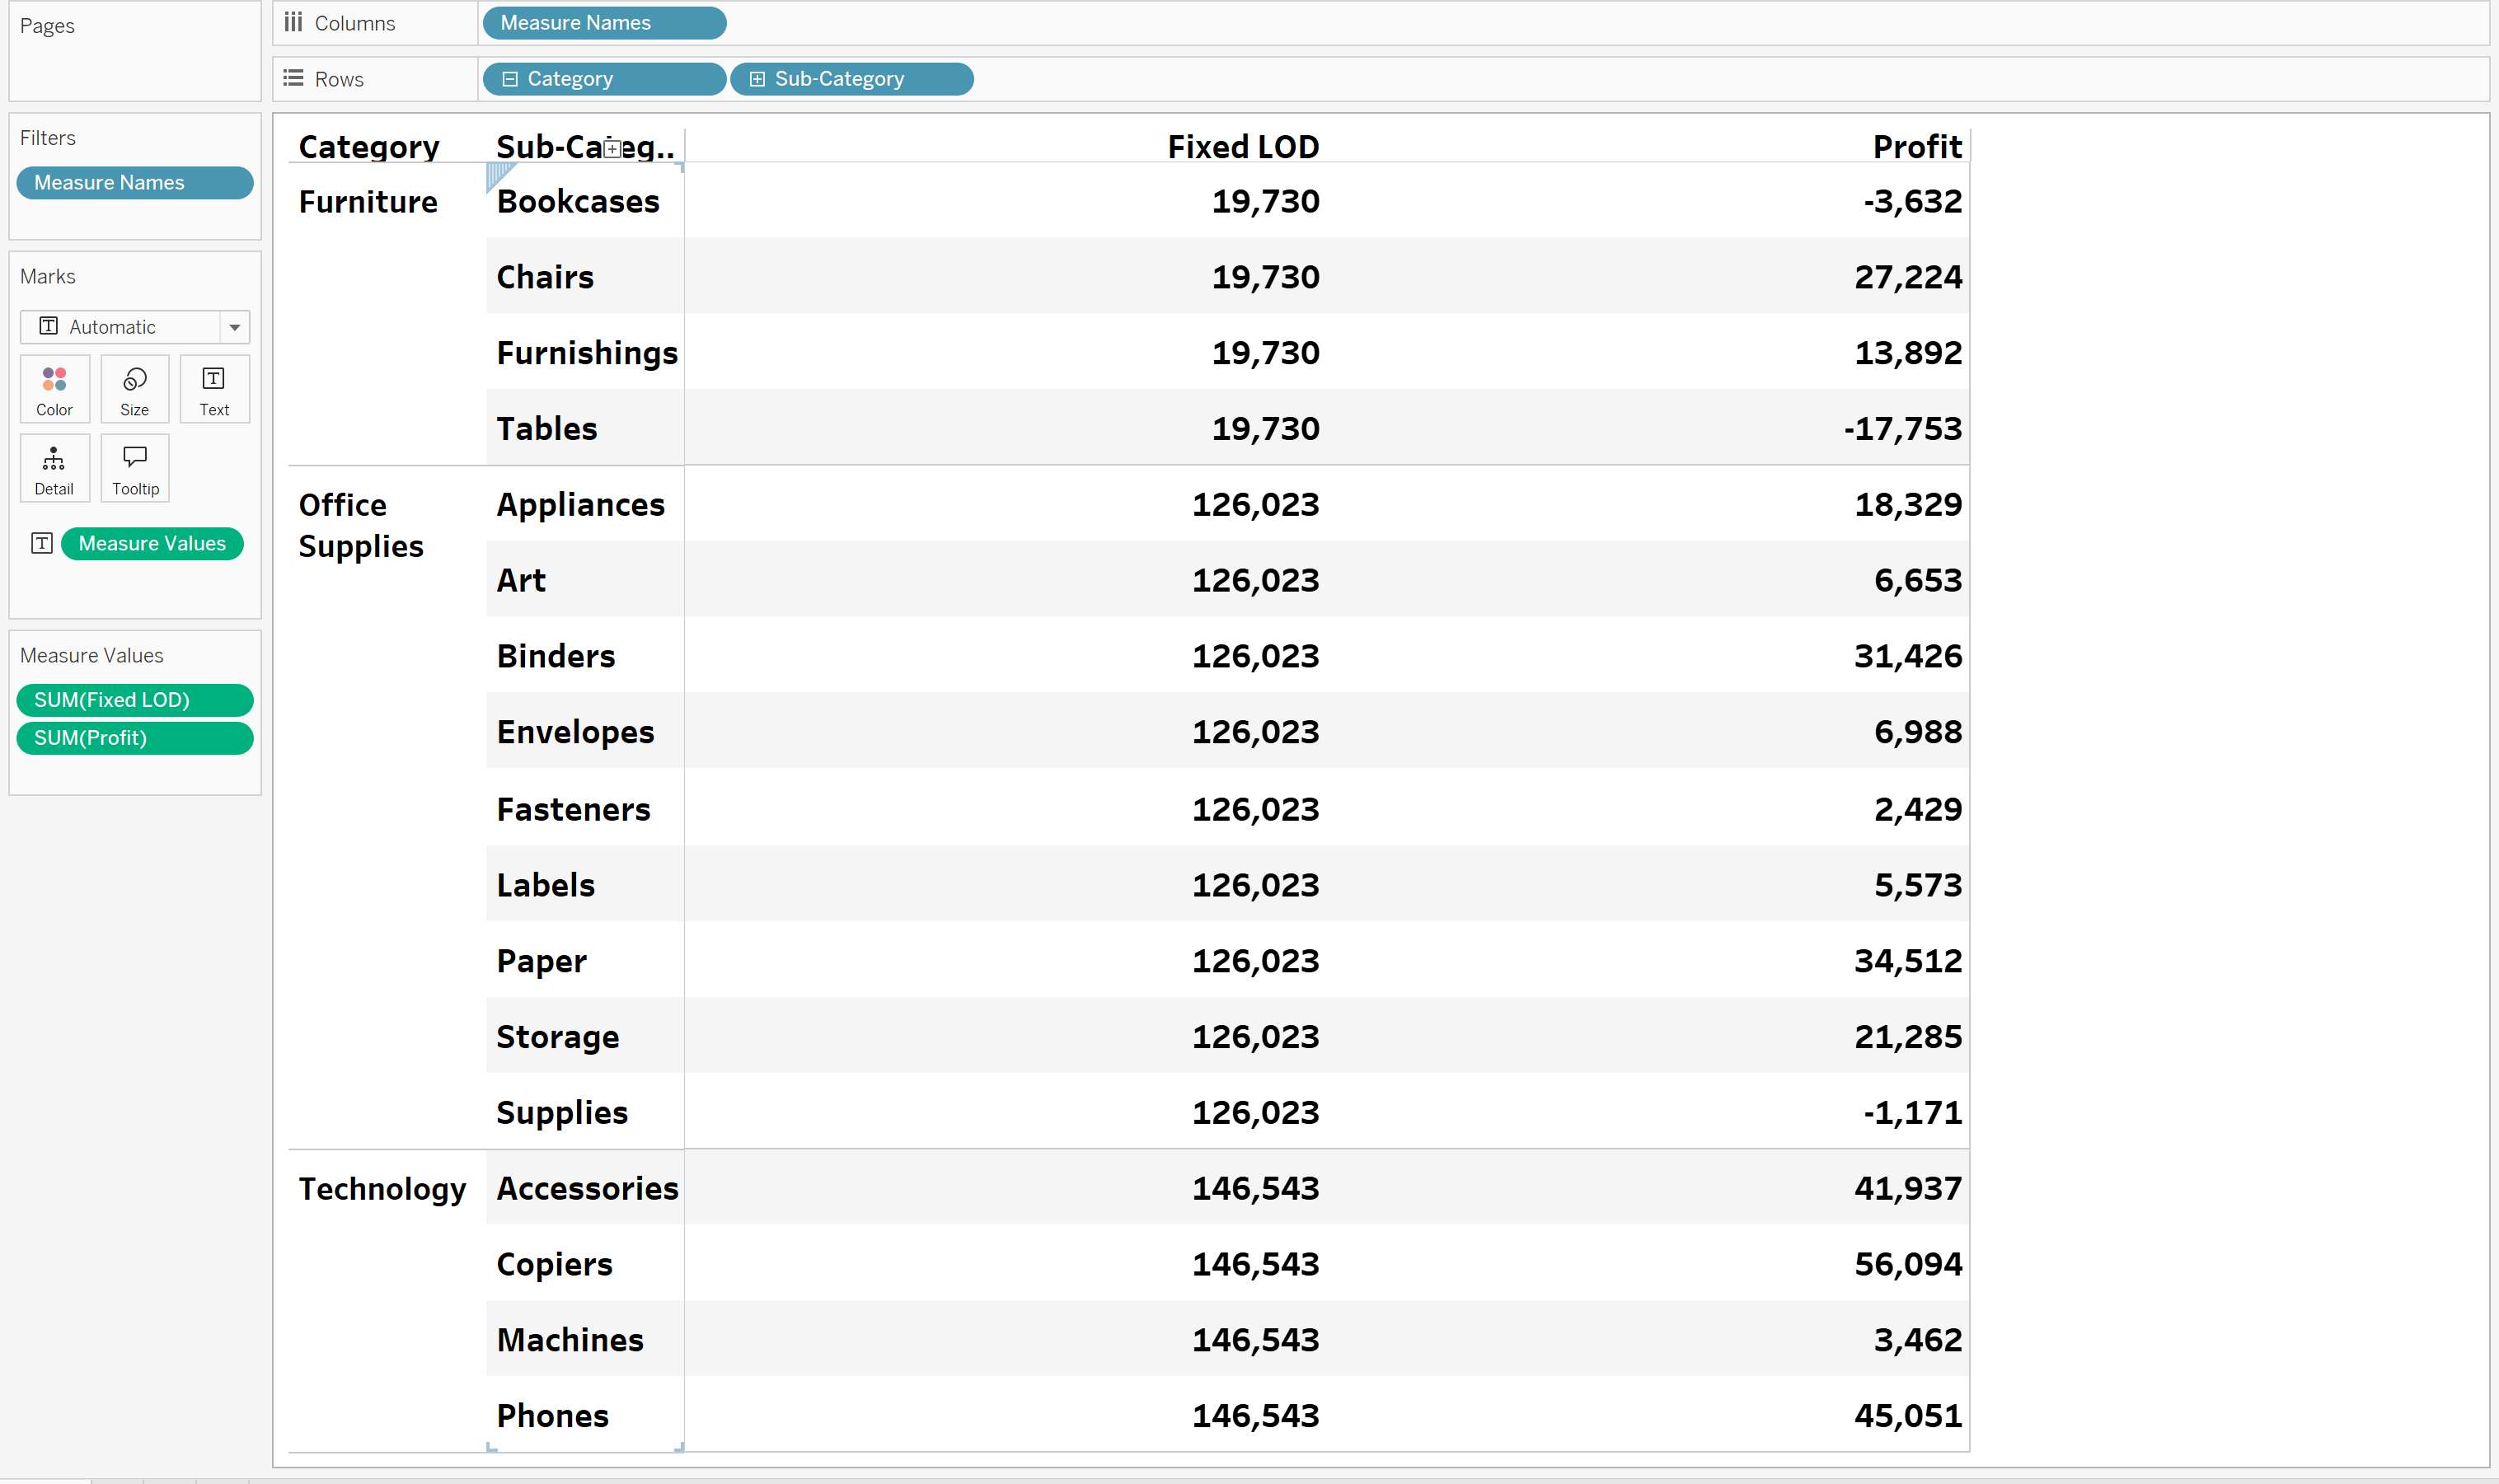
The fixed LOD is represented by the blue bars, notice how they all keep the same value?