Spatial refers to information associated with specific locations on the earth’s surface. Analysing spatial data can help to gain insights, spot patterns and make informed decisions about geographic phenomena.
In this analysis, we’ll use spatial data to identify the three London boroughs with the fewest Sainsbury’s stores. This can provide valuable insight for location planning and resource allocation such as:
- Store Location Planning: Identify optimal locations for new stores based on population density, competitor locations, and traffic patterns.
- Customer Proximity Analysis: Determine which customers are within a certain radius of each store or branch.
- Sales Territory Optimization: Balance territories by geographic area and sales potential to improve coverage and reduce overlap.
The Task:
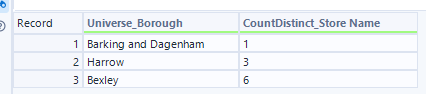
Your mission is to identify the three boroughs in London with the fewest Sainsbury’s stores.
The Data:
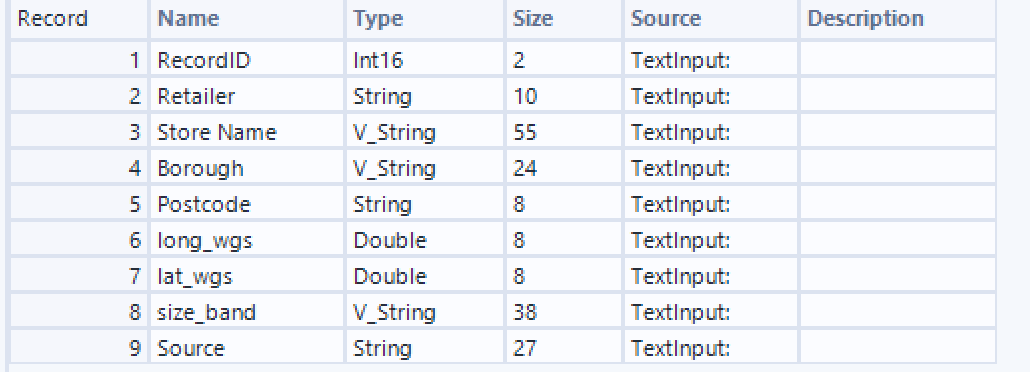
- Sainsbury’s Store Locations: A dataset containing the latitude and longitude of each store across the UK.
- London Boroughs: A spatial dataset containing the geometry of each borough in London.
The Method:
To perform this analysis, we need to ensure our data is in the correct spatial format:
- The London boroughs are already stored as spatial polygons, so they’re ready to use.
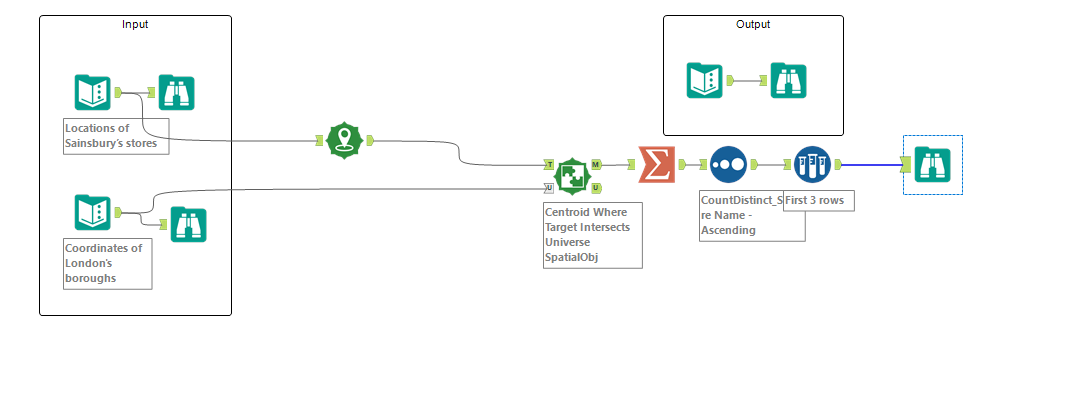
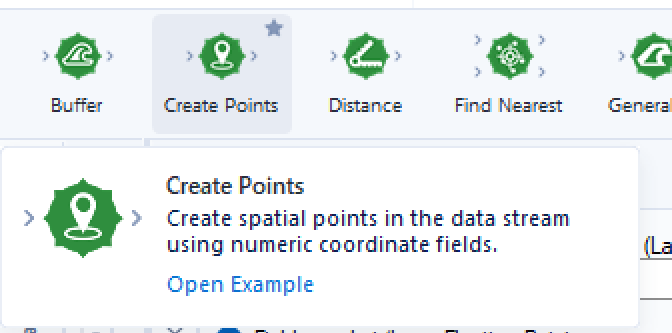
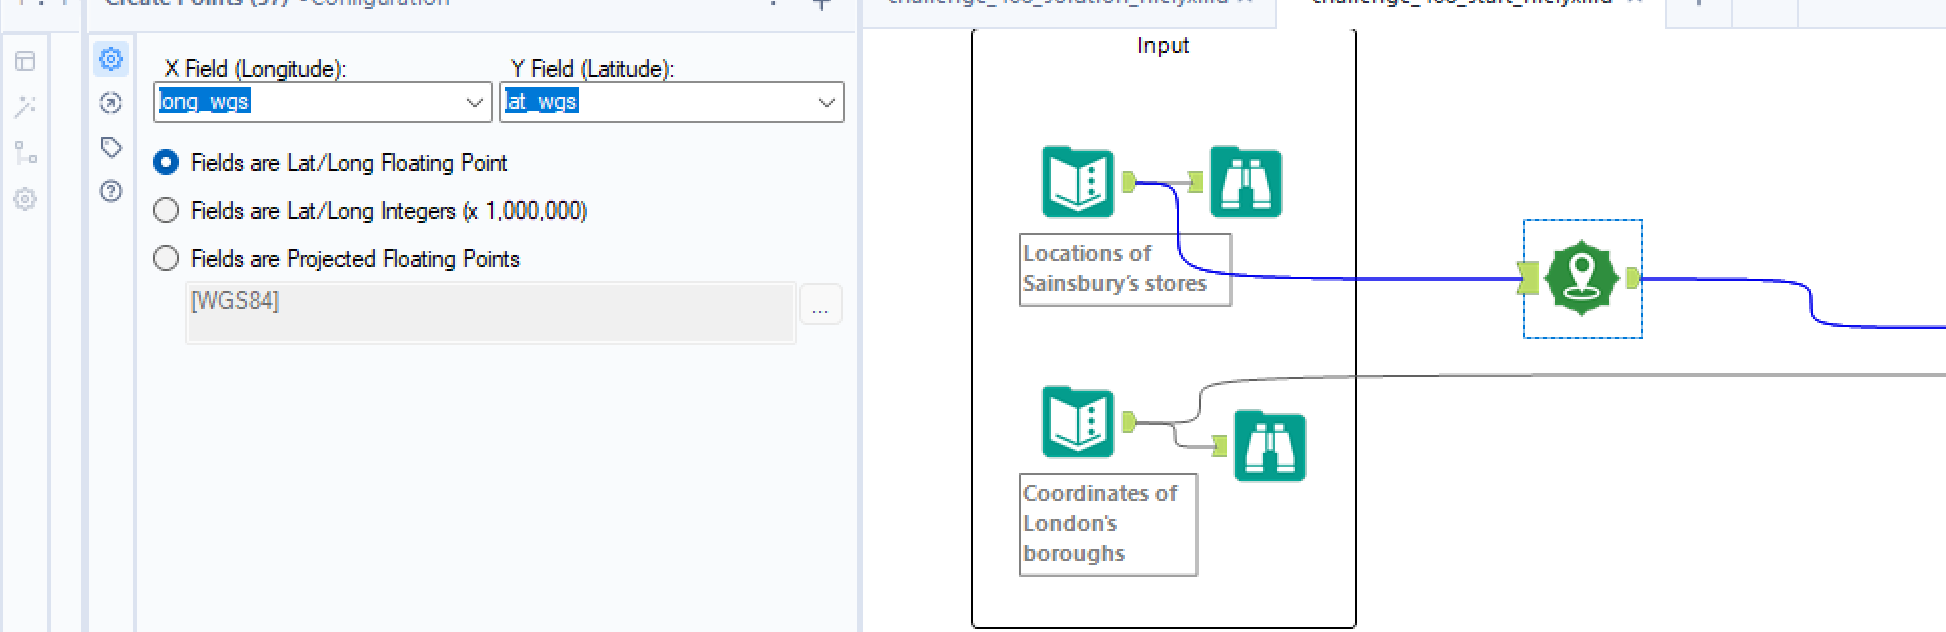
- The Sainsbury’s store locations, however, are currently recorded as longitude and latitude values. These need to be converted into spatial point objects using the Create Points tool in Alteryx.
Why Create Spatial Points?
Creating spatial points is essential because Alteryx’s spatial tools don’t operate on raw coordinates — they require spatial objects (such as points, lines, or polygons). Once the store coordinates are converted into proper spatial points, we can:
- Accurately place each store on the map
- Match stores to boroughs using tools like Spatial Match
- Count how many stores fall within each borough
- Make valid spatial comparisons and calculations
Without converting to spatial points, we wouldn't be able to determine store-to-borough relationships or perform any meaningful geographic analysis.
Now that we’ve prepared the spatial data for both the Sainsbury’s store locations and the London boroughs, the next step is to determine which stores fall within the boundaries of each borough. To do this, we’ll use the Spatial Match tool, which allows us to identify spatial relationships, such as whether one object intersects, touches, or is contained within another.
In this case, we want to match each store (point) to the borough (polygon) it falls inside. To configure the tool correctly:
- Set the Spatial Object Field to the centroid (for borough polygons)
- Select Use Records from U Input (Sainsbury’s store locations)
- Choose the Spatial Object Field as SpatialObj
- Set the match condition to Where Target Intersects Universe
This configuration ensures each store is correctly assigned to the borough it geographically intersects, allowing us to count how many stores are located in each borough.
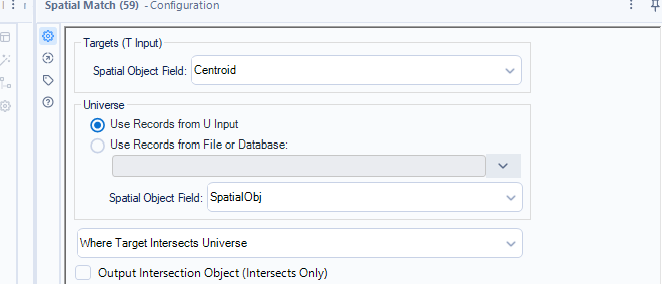
- Use “Target intersects Universe”: Sainsburys= Target, Boroughs= Universe
It gives you each store matched to its borough, letting you count stores per borough
A quick Summarize tool whereby we group by Borough and count by store name, sort the count in ascending order and then a quick sample to get the top 3 rows will give us our three boroughs with the fewest number of Sainsburys.