


The Task
- Connect to the Numbers API directly from Power BI
- Extract and load as much data as they need
- Build a dashboard to explore what interests them - whether that’s highlighting fun facts, identifying patterns in trivia, or creating a calendar view of interesting events
- Publish the dashboard to their Power BI workspaces, ready to present!
Getting the data:
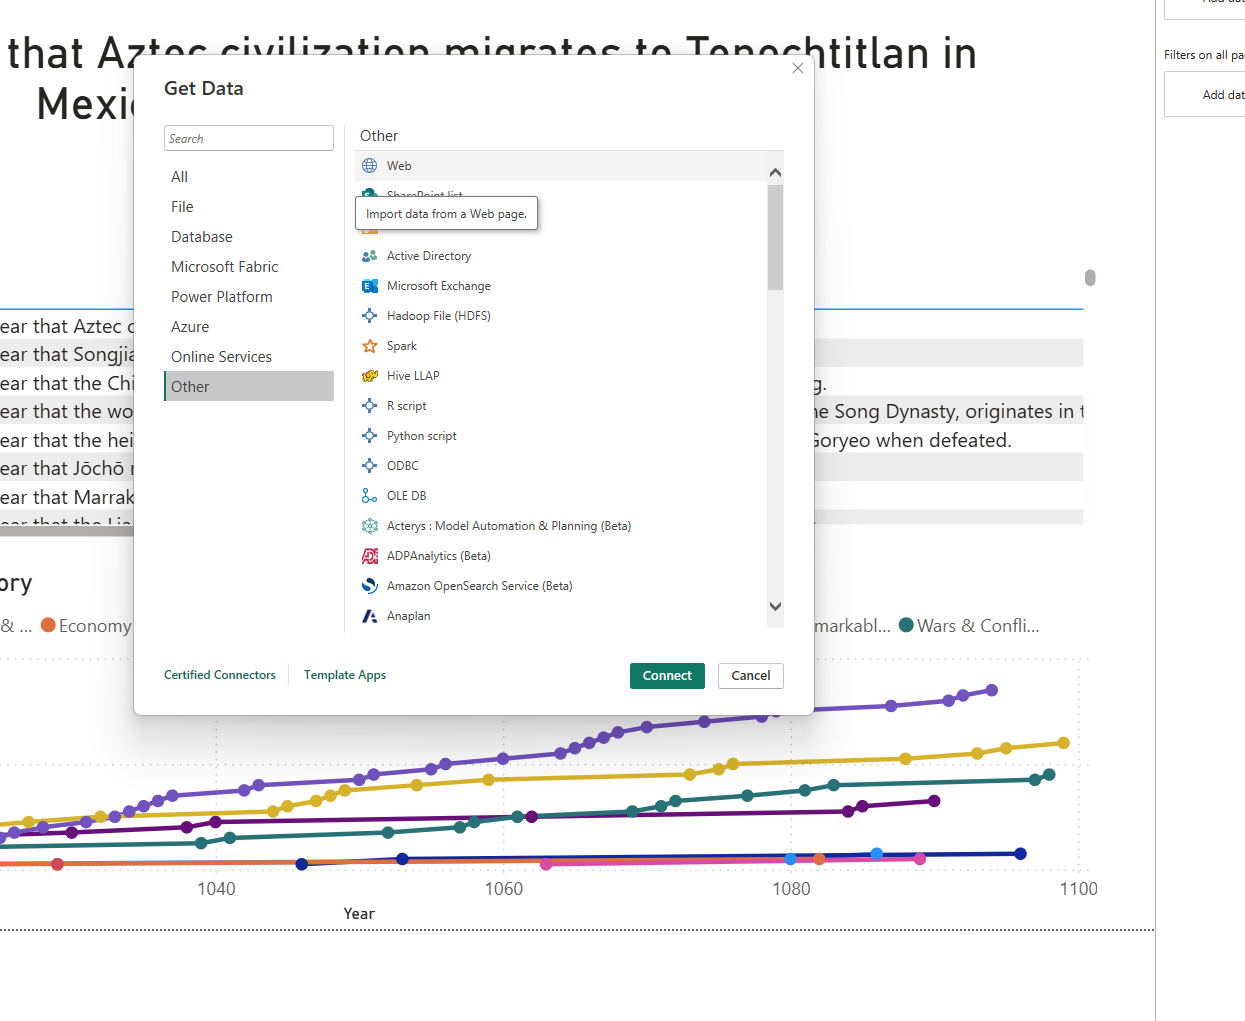
- in Power BI go to Home -> Get Data -> Web
- Grabbed the API call from the Numbers API web page and configured to what I wanted to pull
- In my case I wanted to pull a historical fact about each year, and chose a period that particularly interested me (1000-1100AD)
- http://numbersapi.com/1000..1100/year
- This pulled one fact per year leaving me with 100 rows of text to try and get something out of
My Approach:
Most of the facts in this period were about historical battles, monarchs, and political changes, so I leaned into this theme.
I created additional columns such as [Region] and [Decade] to provide context, and assigned each fact to a category:
- Politics & Leadership (successions, marriages, governments, etc.)
- Religion (Popes, Caliphs, Church leaders)
- Wars & Conflicts (battles, wars)
- Geography & Founding of Places (migrations, settlements)
- Culture, Science & Education (inventions, dictionaries, universities, etc.)
- Natural Events (earthquakes, floods)
To automate classification, I applied text-detection rules. For example, to assign a region:
- if Text.Contains(Text.Lower([Event]), "mexico")
or Text.Contains(Text.Lower([Event]), "tenochtitlan")
or Text.Contains(Text.Lower([Event]), "aztec")
or Text.Contains(Text.Lower([Event]), "inca")
or Text.Contains(Text.Lower([Event]), "maya")
then "Americas"
Or for Category:
- if Text.Contains(Text.Lower([Event]), "pope")
or Text.Contains(Text.Lower([Event]), "patriarch")
or Text.Contains(Text.Lower([Event]), "church")
or Text.Contains(Text.Lower([Event]), "archbishop")
or Text.Contains(Text.Lower([Event]), "pious")
or Text.Contains(Text.Lower([Event]), "caliph")
or Text.Contains(Text.Lower([Event]), "abbot")
or Text.Contains(Text.Lower([Event]), "cathedral")
then "Religion"
This allowed me to create my dashboard:
What went well:
- Connecting to the API was easier than expected
- The challenge allowed me to explore a topic I’m genuinely interested in
- The flexibility of the exercise made the final dashboard feel unique to me
What didn't quite work:
There just wasn't enough information in the facts to get much more analysis out of them. Aside from category type, region, and time of year there was nothing else to gain unless I did research into each historical event which would obviously not be possible in one day. I also needed to touch up the graph titles as they're currently set to default.
Lessons Learnt:
- Read the API web page carefully to find how to format your API URL for Power BI! It's easy to trip up on this.
- Be more focused on what path to go down once data is collected and you finished creating the variables