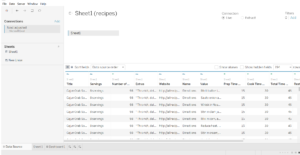
Having spent my second day at the data school getting introduced to Alteryx (and banging my head against the wall), after two hours we had finally cleaned up some data (on popular seafood recipes) and loaded it into Tableau.
You can see how Tom and I prepped the data here and here.

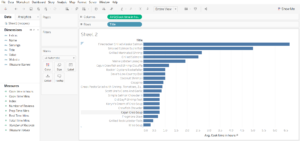
What better way to visualise the data than in a horizontal bar chart comparing the total time required to prepare the meal?

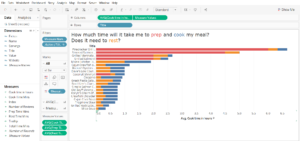
The above graph shows the time to cook each of the meals. But what if we want to see which meal has the least prep time or we can leave to rest overnight or while we’re at work? A stacked bar chart would be ideal to quickly glean this information, but we have our prep, rest and cook times as separate fields…
Having again introduced my head to the cold, hard comfort of the wall I found a solution: Measure values and Measure names
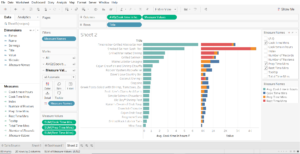
Drag the Measure values pill to the columns bar, right click on the drop-down menu and tick Show filter. This appeared on the right hand side and we selected the fields we wanted to include: prep time; rest time; and cook time.

Next we selected the drop down menu of the Measure values pill and ticked dual axis, the right clicked on the axis and ticked synchronise axis. Unticking show header removes the unnecessary duplicate axis

You’ll notice the Measure names pill has made its way to the marks box and has already given our measure names colours. We changed the chart type to bar, and the format of the Measure values to averages.

A bit of extra tidying up and a colour-coded title later and my head can rest easy.
