Today we faced one of the main fears of data analysts – survey data. It comes in different shapes and forms, frequently not pretty ones, and requires a bit of data prep before it’s ready for analysis and visualization. But it wouldn’t be the worst thing about it. The worst thing this time was to find the data in the maze of the SIPP’s website and get it out in a readable format. Today we were conquering the Survey of Income and Program Participation (SIPP) data. We were able to choose a topic, and I decided to look at the family dynamics.
Dataset
The data is available for download form SIPP’s FTP, and is broken down by year and so-called Waves of research. I downloaded the file for the Wave 4, 2014 Panel in the .SAS format. This is a standard statistical file format used for surveys, and is readable by both Tableau and Alteryx.
A detailed description of the data related to Marital history could be found here.
Data prep
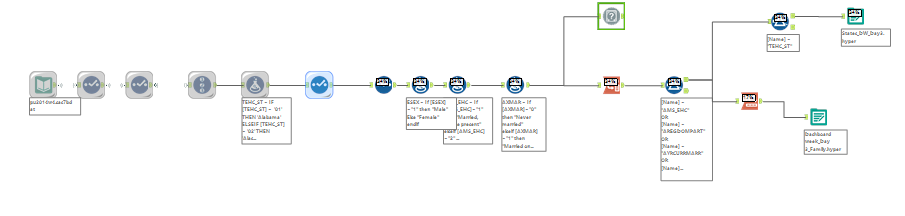
Once I managed to figure out which file to download, I brought it to Alteryx and selected the fields (i.e., survey questions) I needed for my analysis. As it tends to, initially I wanted to bring more data then both myself and Alteryx were able to process, so had to re-scope my initial idea and focus solely on family status of respondents.
Also, before re-shaping the data I brought in the Record ID tool to keep track of responses of individual respondents as each row in the original data set represents answers from one submitted survey form.
It’s not obvious immediately, but the survey data is structured in the following way: one field for a survey question and another for the relevant answer. See an example below:
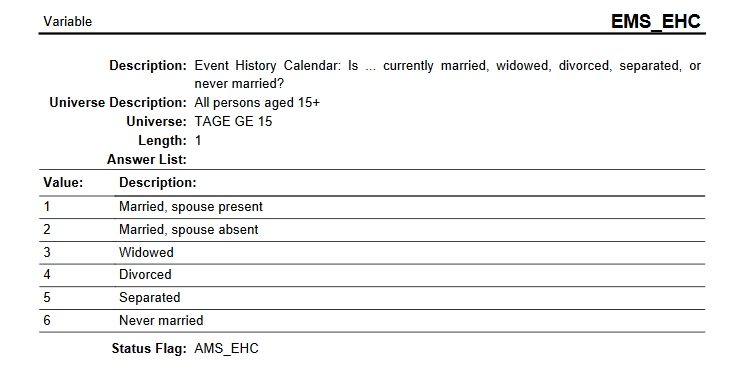
Once I figured that out, I replaced the digits in the answers with relevant descriptions using the Formula tool. Also, big shout out to Chris for sharing his formula for updating the states names!
Visualisation in Tableau
For my dashboard, I wanted to see how the marital statuses differ across different US states, how frequently people marry, and whether there is a correlation between the number of marriages and median income per household.
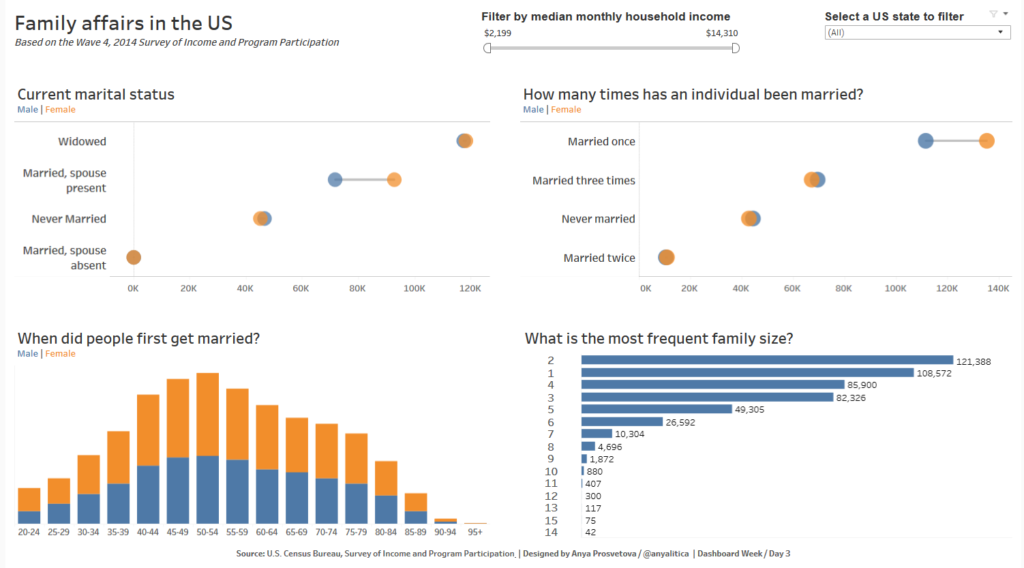
Link to the interactive dashboard on my Tableau Public page.
Let me know if you have any questions.
P.S. – Here are some useful links on working with survey data:
Prepare survey data for analysis with three easy steps