


Progress and Objectives
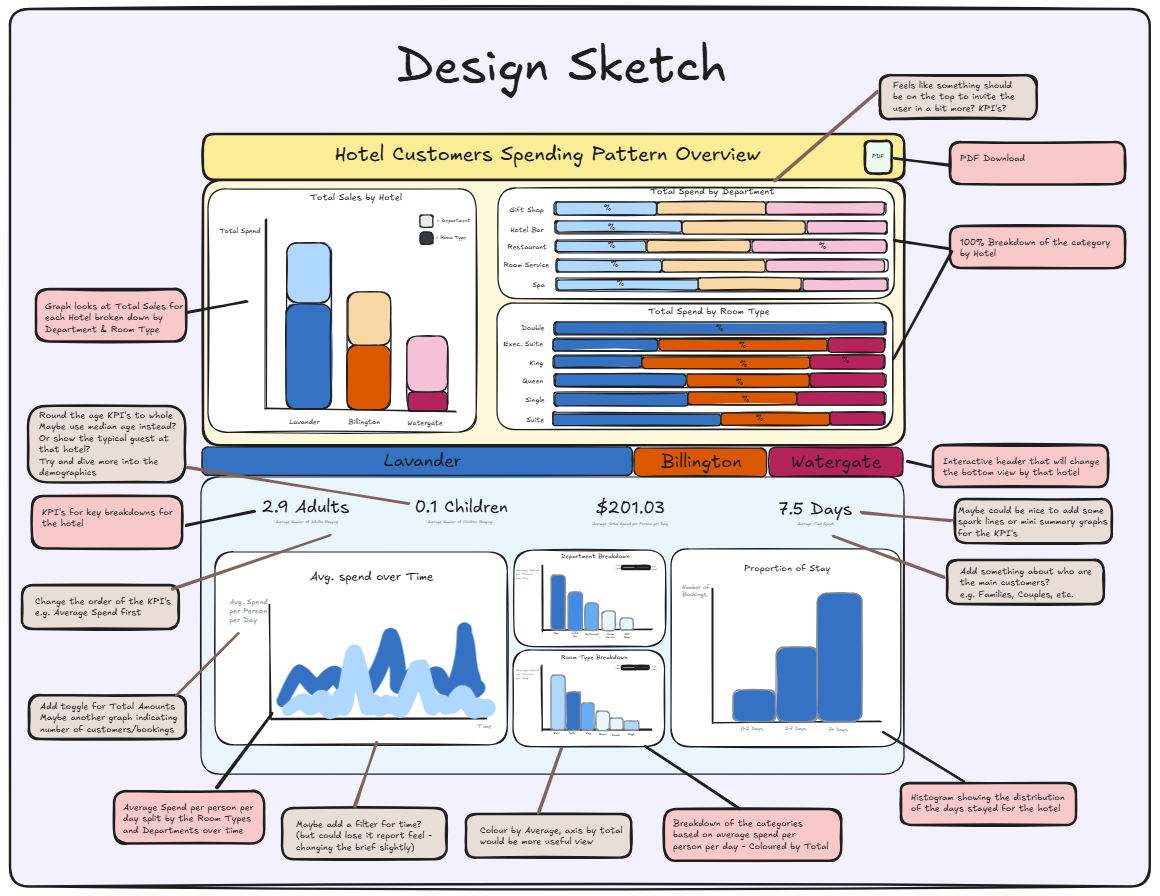
This week, I made significant progress on the Power BI dashboard for a hospitality company managing multiple hotels. The company is keen to analyse customer spending trends to refine service offerings and optimise revenue strategies. My task was to develop a functional dashboard based on an initial sketch provided by a previous consultant, incorporating key performance indicators (KPIs) and additional measures to enhance its analytical capabilities. The project started with an incomplete dashboard design. The consultant before me had mapped out a concept but had not implemented the necessary calculations or visual elements. Upon reviewing the dataset, I found missing data columns and recognised the need for new calculated measures to extract meaningful insights.
Data and Measures Created
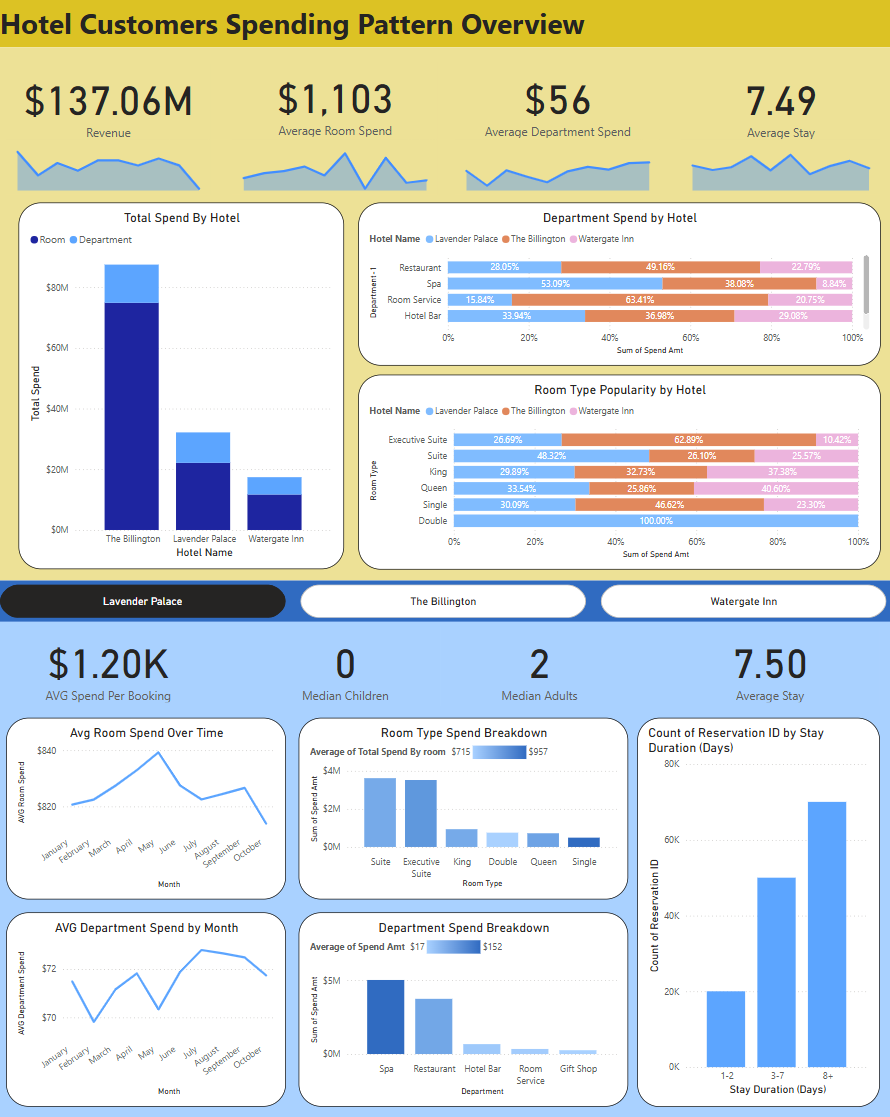
The primary goal was to build a user-friendly dashboard that provides hotel managers with a clear view of customer spending patterns. The dashboard needed to highlight key trends in room expenditure, total revenue, and departmental spending while allowing users to filter and interact with the data dynamically. The dataset consisted of two main tables: Reservations, which contained booking details, average room rates, and stay duration, and Transactions, which recorded additional spending during stays.
To fill in the gaps and enhance the analysis, I created several calculated measures using DAX. One of the key measures was Total Room Spend, which calculates the total spending on rooms based on the average room rate and the length of stay:
Total Room Spend = Reservations[Avg Room Rate] * Reservations[stay_duration]This measure was essential in understanding how room pricing and length of stay impacted overall revenue.
I also created Stay Duration Group to categorise reservations based on stay length:
Stay Duration =
IF(Reservations[stay_duration] <= 2, "0-2",
IF(Reservations[stay_duration] <= 6, "3-6", "7+"))
This grouping allowed for better segmentation of customer types.
Another key measure was Average Spend per Reservation to evaluate revenue efficiency per booking:
Average Spend per Reservation = [Total Revenue] / COUNT(Reservations[reservation_id])This provided insights into how much, on average, customers were spending per booking.
Final Product Dashboard
Feedback and Challenges
The dashboard received positive feedback, with stakeholders appreciating its clarity and functionality. A few suggested improvements included refining rounding and formatting to enhance readability. Challenges included missing data columns requiring new calculated measures, ensuring that all visual elements were intuitive and informative, and balancing performance with usability.
Impact and Lessons Learned
The impact was significant, providing an interactive tool for analysing customer spending patterns, enabling hotel managers to compare spending trends across hotels and services, and streamlining decision-making through clearer, data-driven insights. This project strengthened my Power BI and DAX skills, particularly in creating calculated measures, and improved my ability to translate stakeholder requirements into practical dashboard elements. I learned the importance of checking data availability before designing visualisations and incorporating iterative feedback to create a truly useful dashboard.