


Introduction
Key Performance Indicators (KPIs) help businesses track their progress over time. In Tableau, we can create dynamic KPIs using calculated fields and parameters. This guide will walk you through three essential KPI calculations:
- Current Year vs Previous Year Profit
- Current Year-to-Date vs Previous Year-to-Date Profit
- Current 12 Months vs Previous 12 Months Profit
Each KPI is based on a date selector parameter, which allows users to dynamically choose the reference date for calculations.
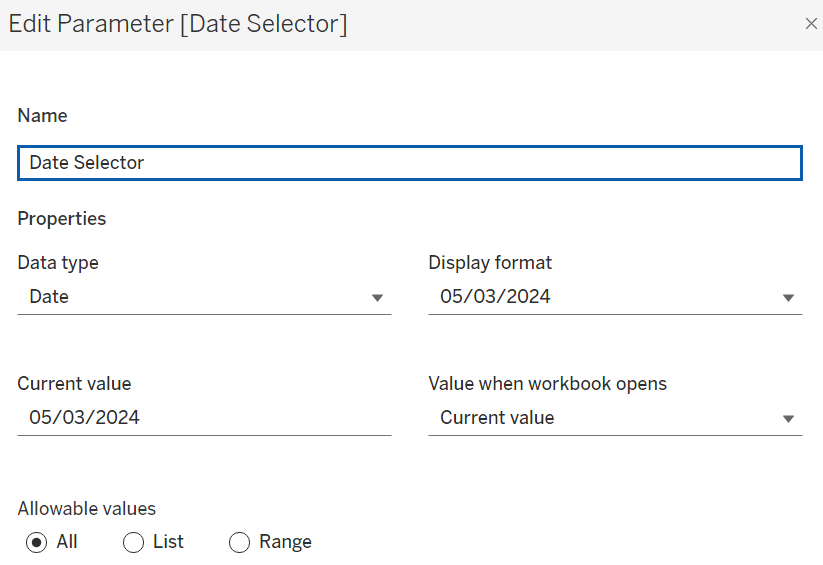
Step 1: Create a Date Selector Parameter
To make our calculations dynamic, we first create a Date Selector parameter:
- Data Type: Date
- Allowable Values: All
- Purpose: Enables users to select a date to base the calculations on.
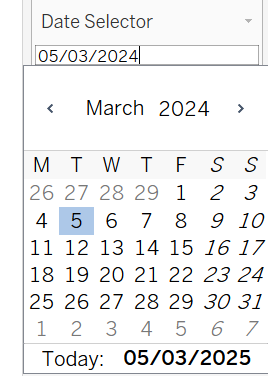
Next, show the parameter on the worksheet so users can select a date.
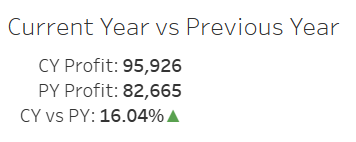
KPI 1: Current Year vs Previous Year Profit
This KPI compares the profit of the current year against the previous year.
Step 1: Calculate Current Year Profit
IF YEAR([Date Selector]) = YEAR([Order Date]) THEN
   [Profit]
END
Explanation: If the Order Date falls in the same year as the Date Selector, then include its profit.
Step 2: Calculate Previous Year Profit
IF YEAR([Date Selector]) -1 = YEAR([Order Date]) THEN
   [Profit]
END
Explanation: If the Order Date is from one year before the Date Selector, then include its profit.
Step 3: Calculate the Difference
(SUM([Current Year Profit]) - SUM([Previous Year Profit])) /
SUM([Previous Year Profit])
Explanation: This formula calculates the percentage change in profit from the previous year to the current year.
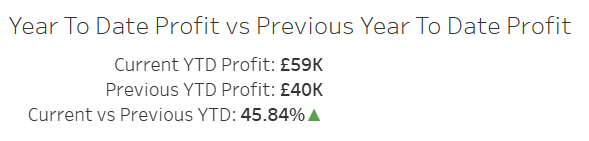
KPI 2: Current Year-To-Date vs Previous Year-To-Date Profit
This KPI compares profits accumulated from the beginning of the year up to the selected date.
Step 1: Calculate Current YTD Profit
IF [Order Date] >= DATETRUNC('year', [Date Selector])
AND [Order Date] <= DATETRUNC('dayofyear', [Date Selector])
THEN
   [Profit]
END
Explanation: This includes all profits from 1st January of the current year up to the selected date.
Step 2: Calculate Previous YTD Profit
IF YEAR([Order Date]) = YEAR([Date Selector]) -1
AND DATEPART('dayofyear', [Order Date]) <=
DATEPART('dayofyear', [Date Selector])
THEN
   [Profit]
END
Explanation: This includes profits from the same period in the previous year up to the same day.
Step 3: Calculate the Difference
(SUM([Current YTD Profit]) - SUM([Previous YTD Profit])) /
SUM([Previous YTD Profit])
Explanation: This calculates the percentage change between this year’s YTD profit and last year’s.
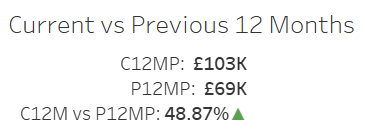
KPI 3: Current 12 Months vs Previous 12 Months Profit
This KPI compares profit from the most recent 12 months to the 12 months before that.
What is This KPI?
Instead of comparing whole years, this calculation evaluates performance over the last 12 months, providing a rolling performance metric.
Step 1: Calculate Current 12 Months Profit
IF [Order Date] <= [Date Selector]
AND [Order Date] > DATEADD('year', -1, [Date Selector])
THEN
   [Profit]
END
Explanation: Includes all profits from the last 12 months leading up to the selected date.
Step 2: Calculate Previous 12 Months Profit
IF [Order Date] <= DATEADD('year', -1, [Date Selector])
AND [Order Date] > DATEADD('year', -2, [Date Selector])
THEN
   [Profit]
END
Explanation: Includes profits from the 12 months prior to the previous 12-month period.
Step 3: Calculate the Difference
(SUM([Current 12 Months Profit]) - SUM([Previous 12 Months Profit])) /
SUM([Previous 12 Months Profit])
Explanation: This calculates the percentage change between the two 12-month periods.
With these calculations, you can dynamically analyse profit trends and track business performance in Tableau. By using a Date Selector Parameter, users can easily adjust the reference date and gain insights into their company’s financial growth.