


Understanding parameters are much more flexible and act as variables within a Tableau workbook. They aren't tied directly to a field but are user-defined values that can be used in a calculation, filter or a reference line.
Parameters
By definition a parameter is a workbook-level variable whose value can be controlled by the user. It's a single value that can be a number, string, date or a boolean. Parameters are a key component for creating dynamic and interactive dashboards.
Use Cases
- 'What-if' analysis - allowing a user to input a sales target and see how it compares to actual sales.
- Measure swapping - Letting a user switch between viewing sales, profit or quantity on a single chart.
- Dynamic Calculations - Changing the value of a key variable in a calculation (i.e. showing a rolling Top N or Bottom N based on a user-selected number)
The Key Characteristics
- Single-select only
- Workbook-wide scope, meaning they can affect any sheet in the workbook.
- Values are user-defined and not always limited to the data source - unless preset.
- In order for them to work, they have to b used in a calculated field in order to affect the visualizations.
How to use them together for Maximum Impact
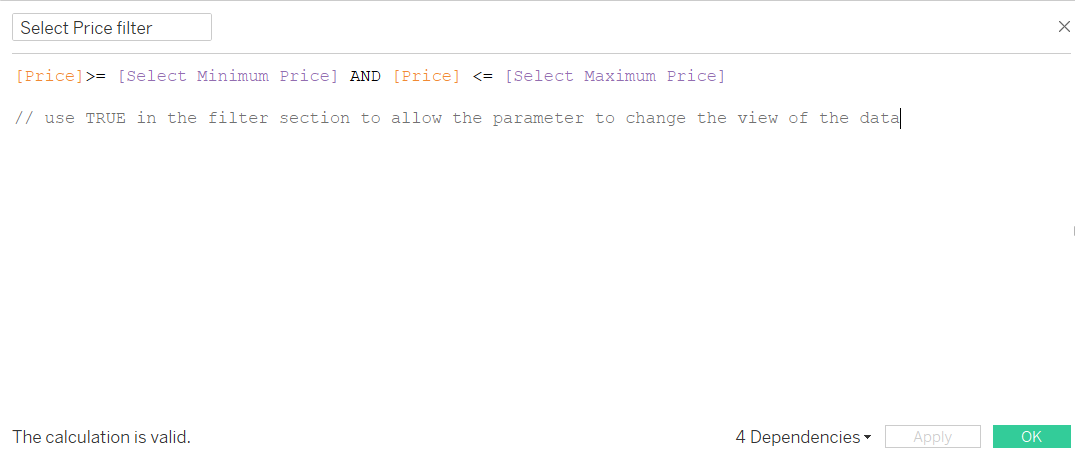
In order to make parameters work in Tableau a calculated field that uses it's value. This field is then what is used as a filter.
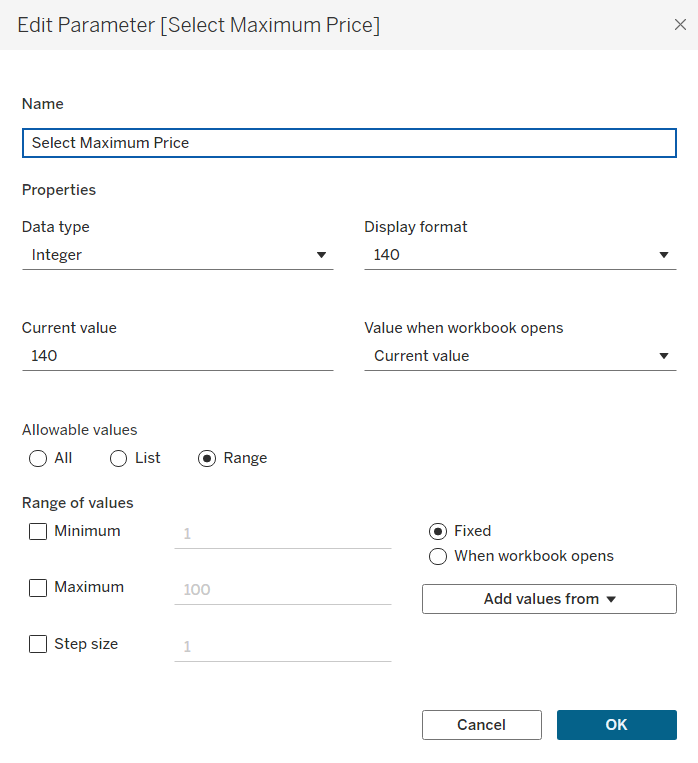
In order to create a parameter for the user to select a price range to change the view of a chart for example you would need to do the following:
- First, create the parameter for the maximum price:
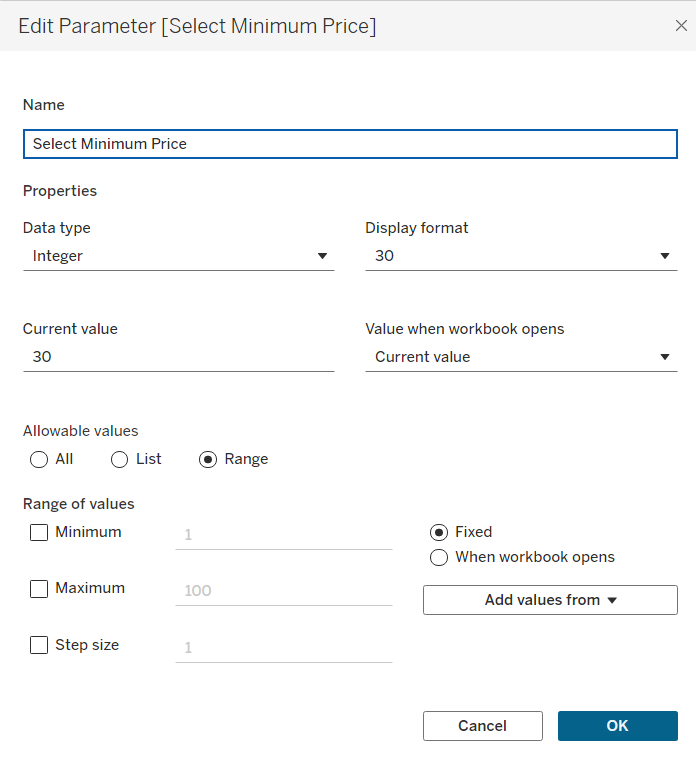
- Then create a parameter for the minimum price:
- Then a calculated field is required to use this on the chart:
Best Practices and Tips:
- Label everything: make sure to use clear labels and titles for the filters and parameters to ensure ease for the user.
- Hide redundancy: If a parameter and a filter are doing the same thing, hide one of them.
- Performance: Use filters for simple data reduction, as they are often more performant than parameters.