


You've built a dashboard that shows your total lemonade sales by the month. It's a great high-level view, but what if you need to answer a more complex question? For example: "What was the average price per customer for each month?"
The problem is, your chart is already aggregated to the monthly level. To answer this new question, you need to calculate an average at the customer level, which is a different granularity, and then look at it in the context of the monthly view. This is where Level of Detail (LOD) calculations come in.
Think of your dashboard as a window. The way you've set it up (e.g., showing daily sales) determines what you can see. That's your visualisation granularity. LODs are like a special magnifying glass that lets you "look" at the data at a completely different level, your calculation granularity, without changing what's in the window. This lets you ask and answer more complex questions. They allow you to define the granularity of a calculation independently of the granularity of your visualisation.
The general equation for LODs is as follows:
{ FIXED/INCLUDE/EXCLUDE [Dimension] : [Aggregation] }
FIXED/INCLUDE/EXCLUDE represents the scope and lets you determine the granularity at which you wish to compute at.
It is also important to note that you need to aggregate what ever measure you want to compute.
The Three Types of LODs
1. FIXED
The FIXED LOD calculation computes a value using only specified dimensions, completely ignoring the dimensions in your view. It's like a static calculation that remains constant no matter how you filter or group your data in the visualisation.
- Syntax:
{FIXED [Dimension] : [Aggregation]}
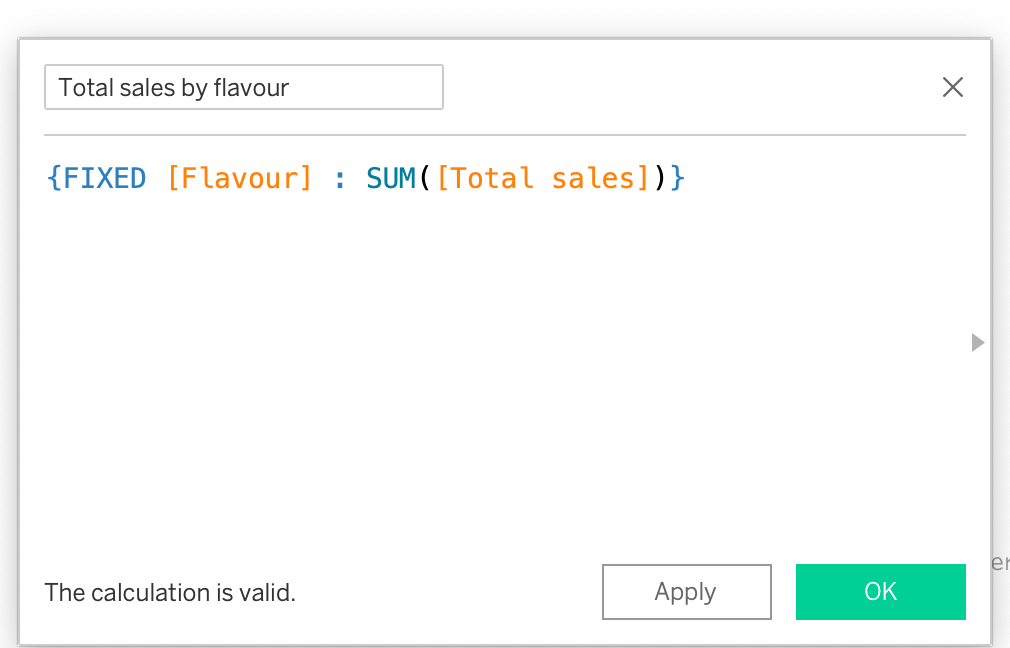
Example: To find the total amount each lemonade flavour sold for, you would use: {FIXED [Flavour] : SUM([Total sales])}. This simply means the aggregation is fixed at the flavour level, and all other dimensions are ignored.
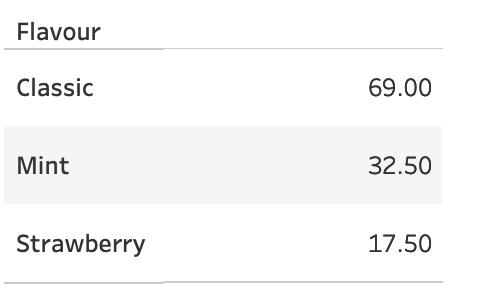
To demonstrate this, below you will see the total sales for each flavor listed in a table view.
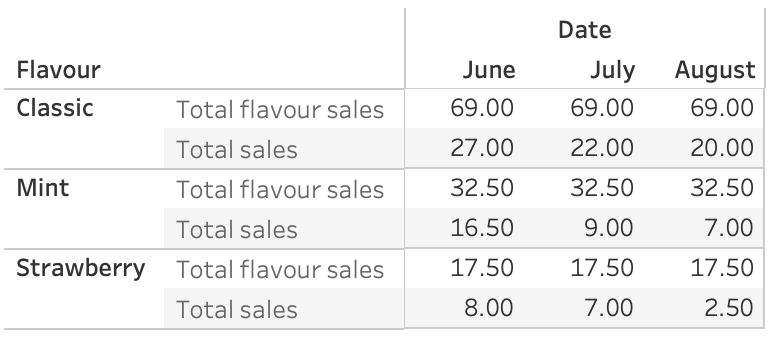
If you view the total sales compared to the sales by flavour fixed LOD, you will notice that the LOD row will not change if you try and view it by date. This is because the calculation is fixed at the flavour level, and unaffected by the monthly breakdown.
2. INCLUDE
The INCLUDE LOD calculation computes a value using the dimensions in the view, plus any additional specified dimensions. It's useful for adding a finer level of detail to your current view.
- Syntax:
{INCLUDE [Dimension] : [Aggregation]}
Example: If your view shows sales by flavour, but you want to see the average sales per customer for each flavour, you would use: `{INCLUDE [Customer ID]: sum([SalesAmount])}, then you find the average.
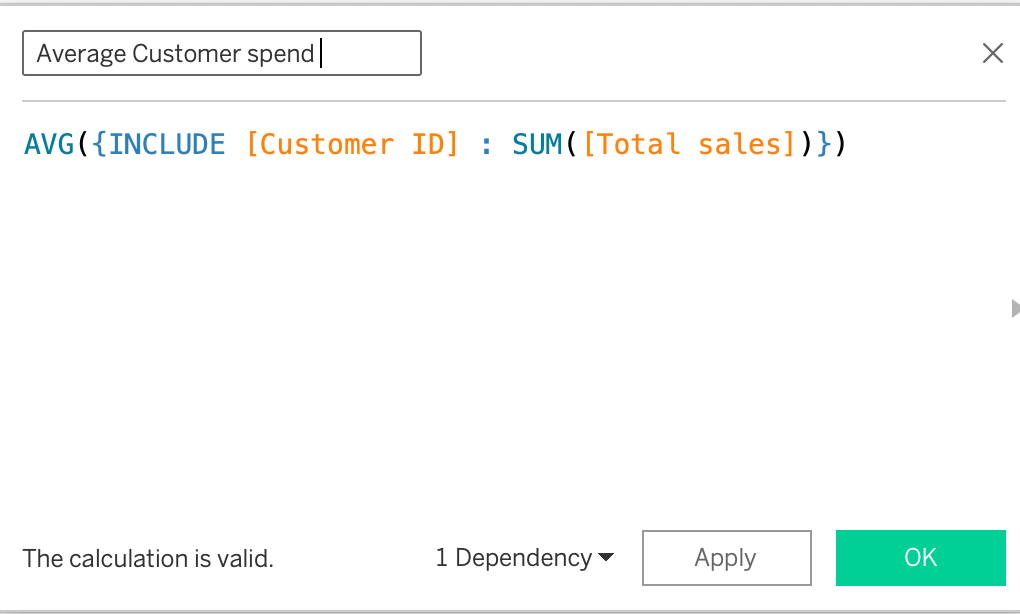
This calculation is performed at the level of flavour, but adds customer id to its granularity. If you were to just use AVG([Total Sales]) without an LOD, Tableau would simply take all the individual transactions for a given flavour and find their average.
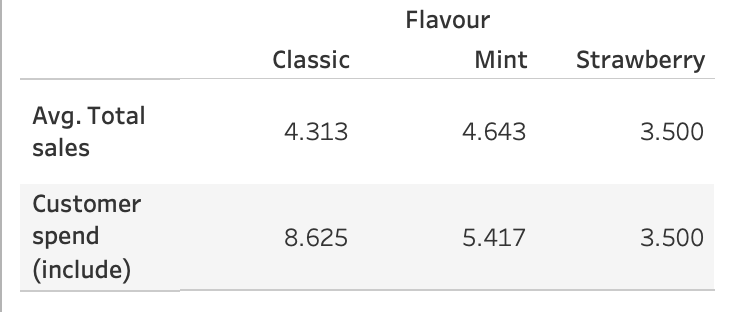
The LOD calculation, answers a completely different question: "What was the average amount a single customer spent on that flavour?"
3. EXCLUDE
The EXCLUDE LOD calculation computes a value using all dimensions in the view, except for any specified dimensions. It's used to "roll up" a calculation to a higher granularity.
- Syntax:
{EXCLUDE [Dimension] : [Aggregation]} - Example: If your chart shows sales by
cup size, but you want to see the total sales for the entire day, you would use:{EXCLUDE [cup size] : SUM([Total sales])}.
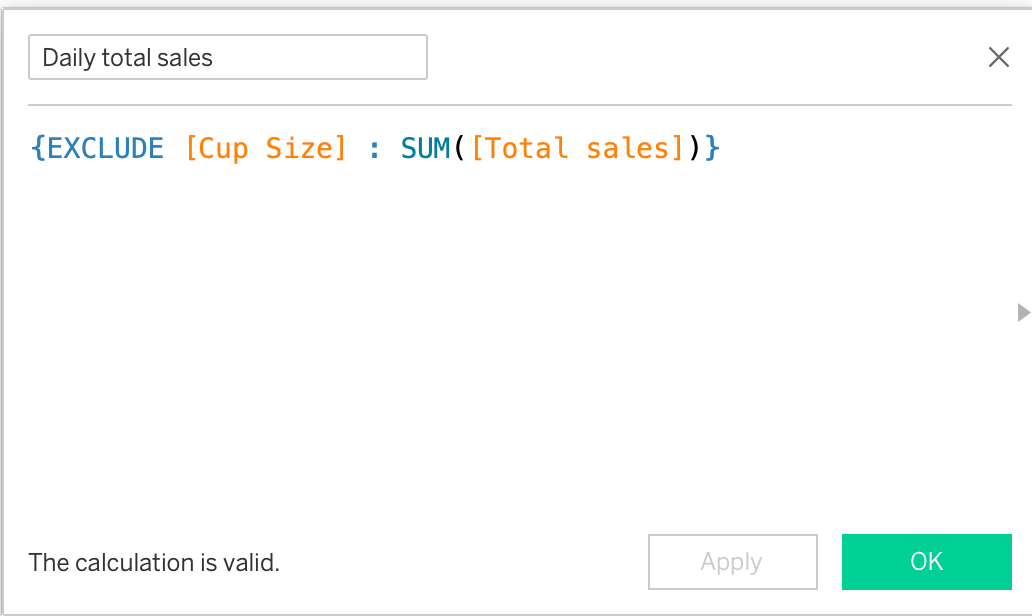
This calculation ignores the cup size detail and gives you a single daily total.
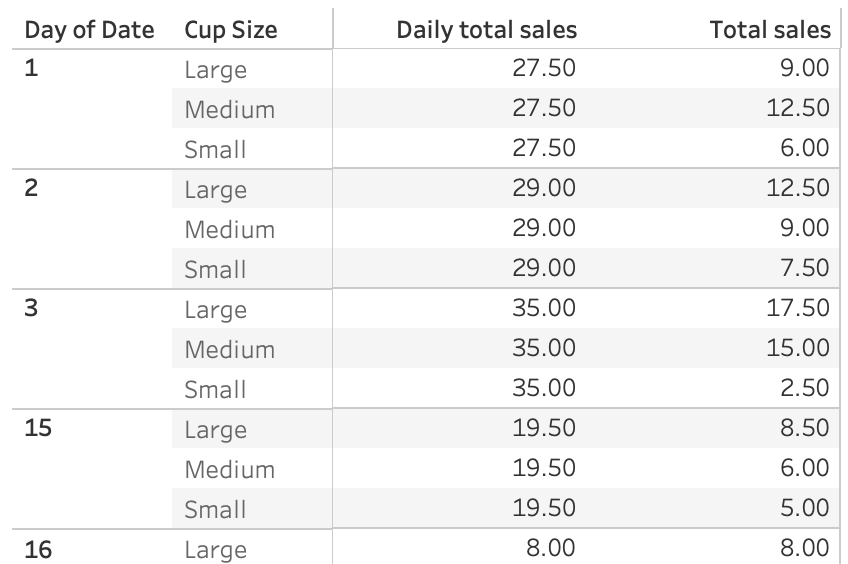
You now see the daily total sales repeated next to each row, allowing you to compare individual sales to the daily total.