


The Brief
It's Dashboard Week again—time really does fly when you're having fun! This week follows the familiar format: working independently, creating a sketch, building a dashboard, and presenting our work at 3:30 PM. Today's challenge came from the Fabric Data Days Dataviz Contest: creating a visual CV/Resume in Power BI.
The Task
The brief was straightforward:
- Create my own CV dataset
- Build a visual CV in Power BI
- Publish to Power BI Service
- Submit the entry to the contest gallery
My Approach
Planning and Preparation
I started by reading through the brief to ensure I understood all the requirements. Once I had a clear picture of what was expected, I wrote up a rough plan (which i ended up loosely following)
The first step was dusting off my actual to determine what information I wanted to include in my visual dashboard. This helped me think through the structure and content before diving into the design phase.
Finding Inspiration
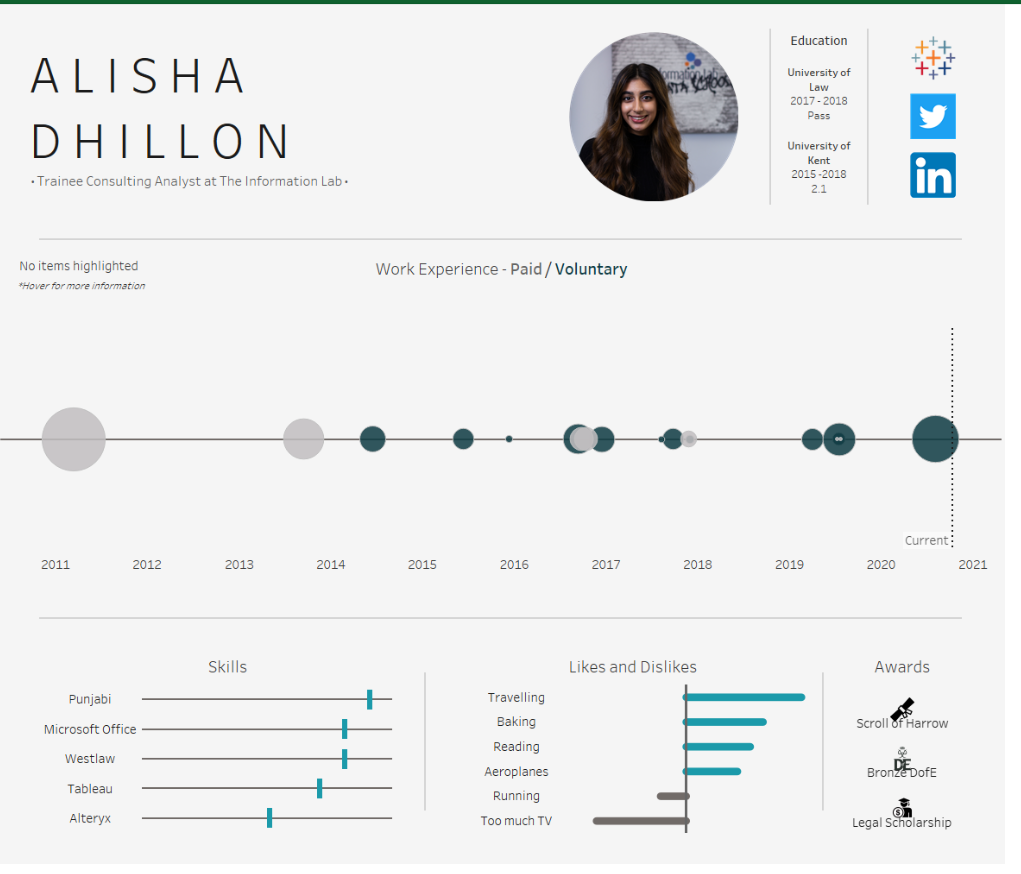
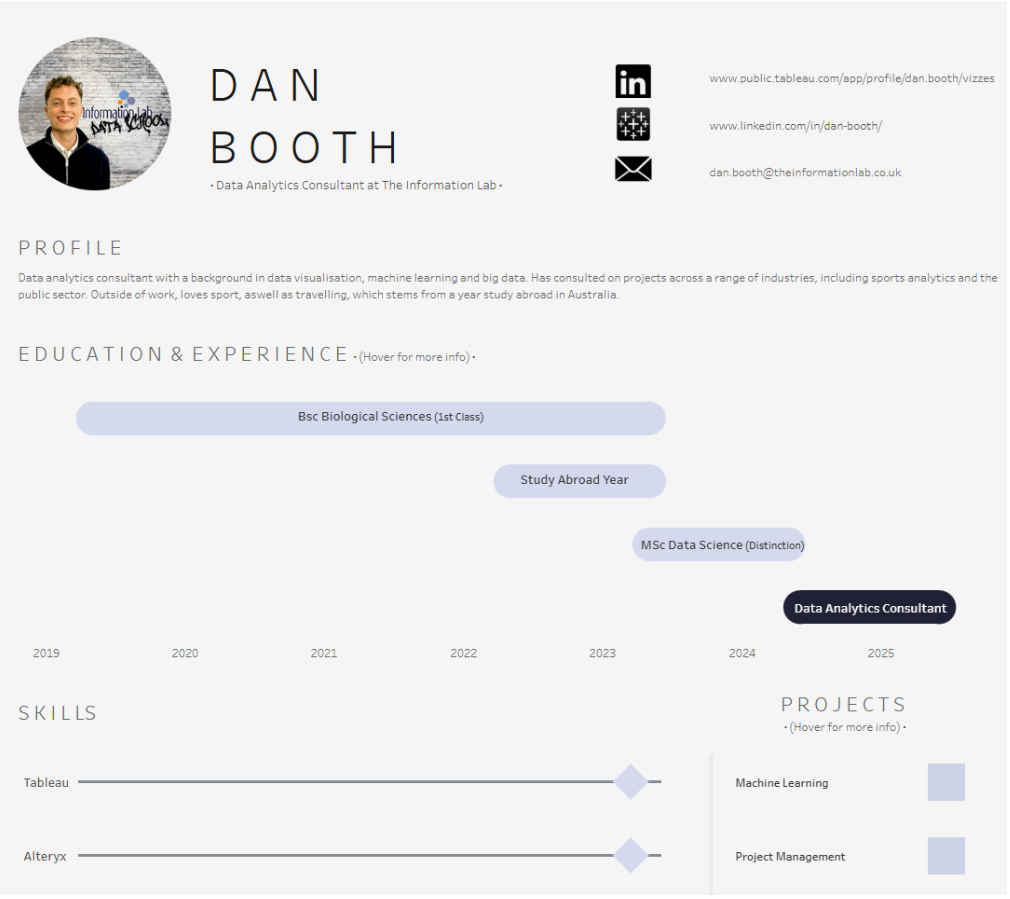
With my content mapped out, I began searching for inspiration from different dashboards. I browsed through Tableau Public and The Data School blog to see how others had approached similar visual CV projects.
Here's where things got a bit off-track: while looking at various dashboards, I found myself exploring what was possible (or not) in Power BI for far too long, rather than staying focused on my original plan. In hindsight, I probably should have specifically searched for Power BI examples rather than Tableau ones from the start.
Despite the detour, I bookmarked and screenshot several dashboards that caught my eye and could inform my design decisions:
Sketching the Design
I created my dashboard sketch using Excalidraw, mapping out the layout and key components I wanted to include:
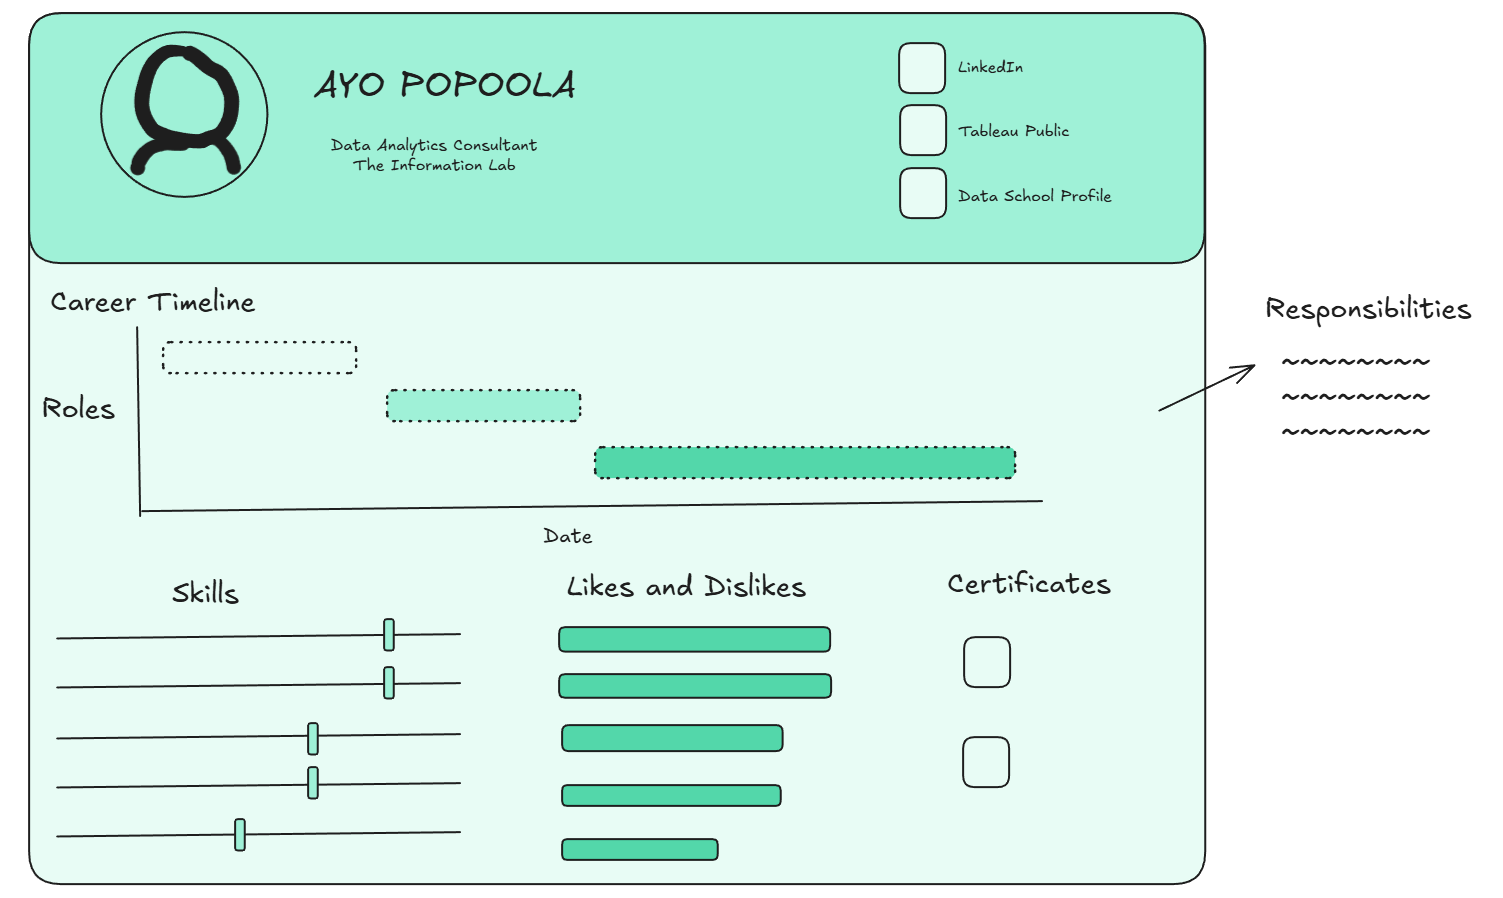
(Yes I drew a portrait of myself)
Building in Power BI
Working on this task in Power BI was an interesting experience and served as a great reminder of the differences between tools. Some things that are straightforward in Tableau require different approaches in Power BI, and vice versa. It was a valuable exercise in understanding the strengths and limitations of each platform.
I built out my dashboard and managed to incorporate most of the functionality I had envisioned in my sketch.
