Today's Dashboard Week challenge shifted our focus to something critically important: accessibility. We were tasked with creating dashboards for non-normative users (people who experience barriers with traditional dashboard designs).
The Morning Session
DS53 started the day with a session led by Louisa, who guided us through key considerations when creating accessible dashboards. One quote that really stuck with me was:
"Participation doesn't require a particular design, but a particular design can prohibit participation."
This is a reminder that our design choices can either open doors or close them for entire groups of users.
Meet Chloe: Understanding My User
My dashboard user is Chloe from the Mayor's Office. She's passionate about promoting inclusive tourism in London, but she's also open about living with dyslexia and dyscalculia. Most city planning dashboards are overwhelming or unusable for her.
The dashboard I'm creating is for users like Chloe who struggle with similar disabilities. They want to visit London attractions but aren't sure which locations might be accessible for them or someone they're traveling with.
My Approach
Time Management Plan
With only 4.5 hours to complete the task, I structured my day carefully:
- 11:00 - 11:20 → Plan
- 11:20 - 12:00 → Look for inspiration and research tips
- 12:00 - 12:30 → Create sketch
- 12:30 - 3:30 → Build the dashboard
Research and Planning Phase
I spent time researching on The Data School blog and across the web for tips on creating dashboards with minimal cognitive overload. This research directly informed several design decisions:
Key principles I focused on:
- Using plain, clear language instead of jargon
- Minimizing the number of colors and ensuring high contrast
- Avoiding heavy grid layouts and dense legends
- Showing rankings visually rather than numerically
- Using list filters instead of dropdowns for better visibility
I also searched for accessible color palettes on Coolors to ensure my color choices would work for users with various visual processing challenges.
I built my sketch in Excalidraw to visualize the dashboard structure before diving into Tableau and taking a different route with my design choice.
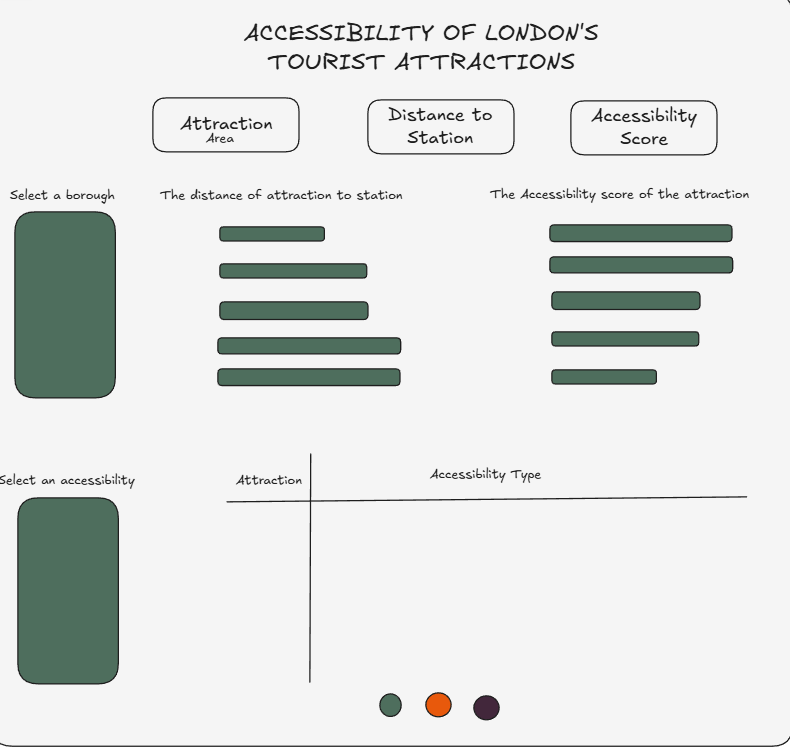
Dashboard Features
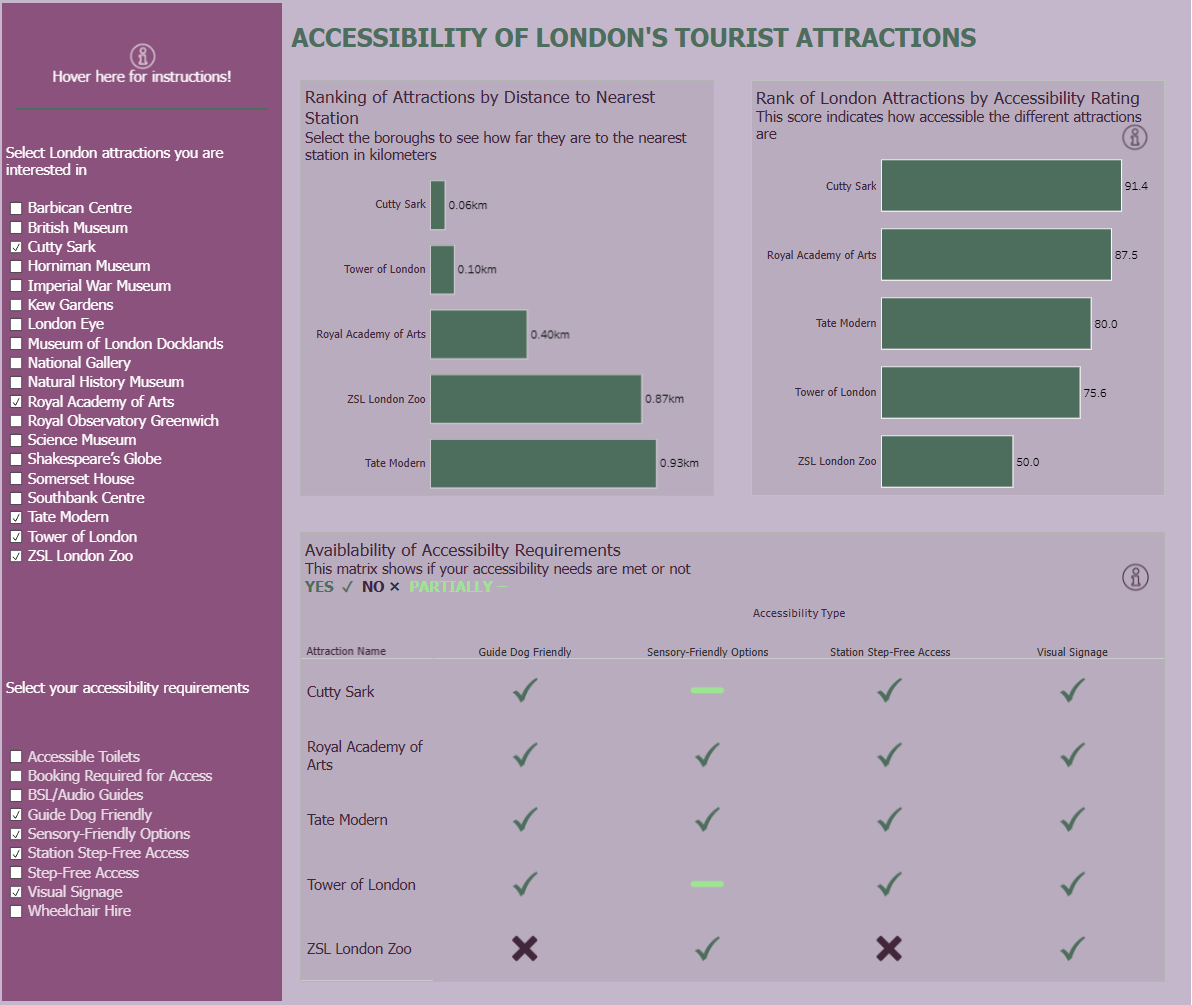
1. Distance-Based Rankings
A bar chart showing attractions ranked by distance to the nearest station. Users can filter to include only the attractions they're interested in, making the comparison manageable and relevant to their needs.
Design considerations:
- Horizontal bars (easier to read than vertical)
- Direct labeling instead of legends
- Clear, simple titles
- Limited color palette
2. Accessibility Score (The Learning Curve)
I created an Accessibility Score using calculated fields that converted categorical and distance data into a weighted numerical score. This was then visualized in a bar chart ranking attractions.
The challenge: Building this required creating multiple calculated fields to weight different accessibility features. However, the feedback I received highlighted a fundamental issue, there's no objective way to determine what weighting to assign to each requirement. What matters most varies dramatically from person to person. Someone who uses a wheelchair has completely different priorities than someone with visual or auditory processing challenges.
This score, while well-intentioned, wasn't truly inclusive because it assumed a universal hierarchy of needs that simply doesn't exist.
Lesson learned: Sometimes simplicity and transparency serve users better than complex calculations that hide assumptions.
I probably spent too much time wrestling with these weightings, which ate into the time I should have spent polishing other aspects of the dashboard.
3. Accessibility Requirements Matrix
The core feature: a matrix showing the availability of accessibility requirements at different London attractions.
How it works:
- Users can see at a glance which attractions offer which accessibility features
- A list filter allows users to select the specific accessibility requirements that concern them
- Another filter lets users select the London attractions they're interested in visiting
- Visual indicators make it easy to spot availability without interpreting numbers or percentages
Why this design:
- List filters keep all options visible (no hidden dropdowns)
- The matrix format allows quick scanning
- Users can customize the view based on their specific needs
- No complex calculations or weighted scores, just clear, factual information