Data transformation is used to clean data, making it easier to work with. Sometimes field names or dates may be written in a format which is difficult to work with. Perhaps it isn't in the format needed, or even formatted the same as other data in the same table. Null values can also be amended and certain fields can be selected or deselected, as well as changing data types. The Select tool, as well as the Data Cleansing tool, can be used to amend spelling and remove Null values. The select tool can be used to choose certain fields or change the data type.
When information wants to be moved from a column to a row, or vise-versa, a Transpose or Cross-Tab tool should be used. A rule of thumb is a Transpose tool makes a table thinner and longer, whilst a Cross-Tab tool makes a table wider and shorter. The whole idea is to make the table easier to use when loaded into a visualisation tool such as Tableau.
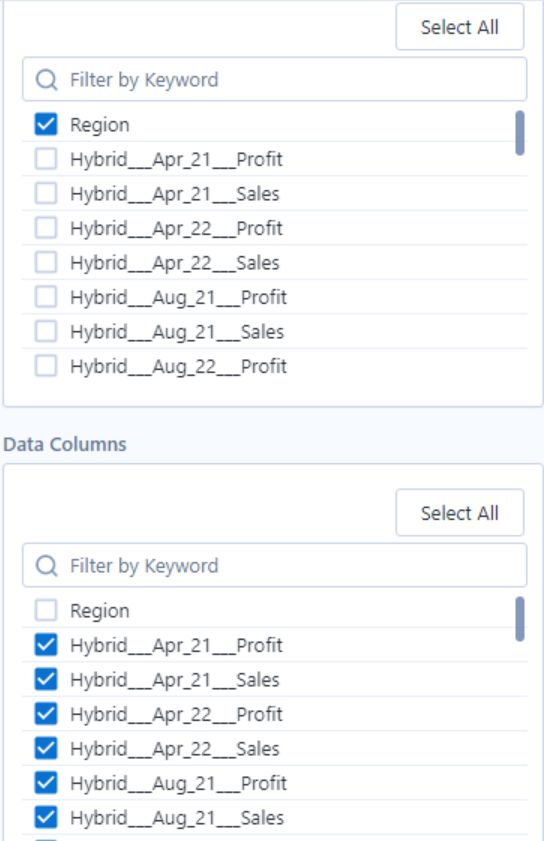
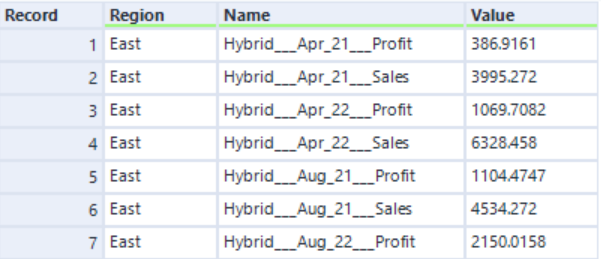
A Transpose tool (or columns-to-rows) moves horizontal data to a vertical axis. On the configuration pane, there are two sections. One for 'Key Data' which is the data that shall be kept horizontal. The other is 'Data Columns', which selects the fields which shall be moved into a vertical axis.
See the examples below to understand how the data is split and moved and what options have been selected.
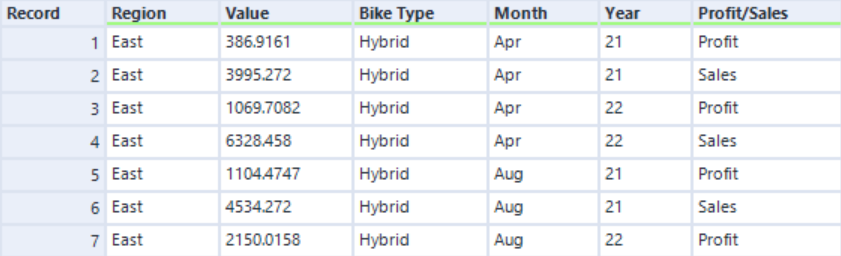
A Cross-Tab tool is used when information the rows wants to be split into separate columns. For example, a column may state if the information falls into one category or another. The corresponding values may be better in their own separate columns.
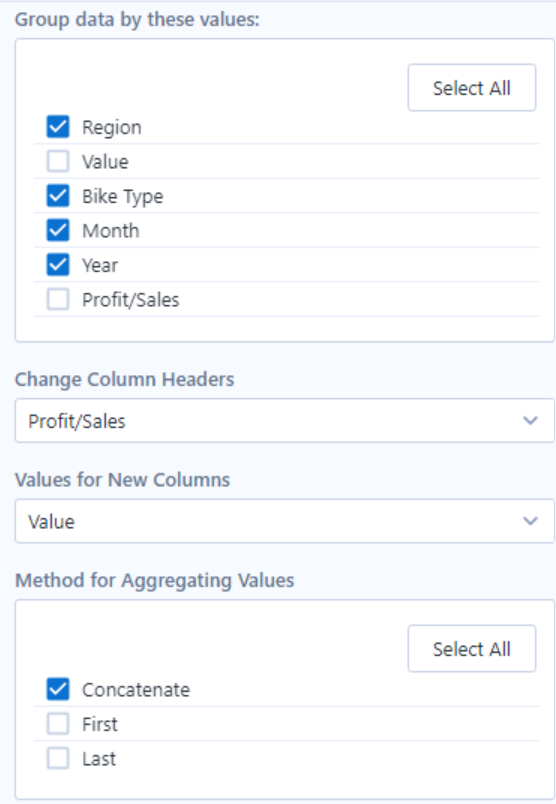
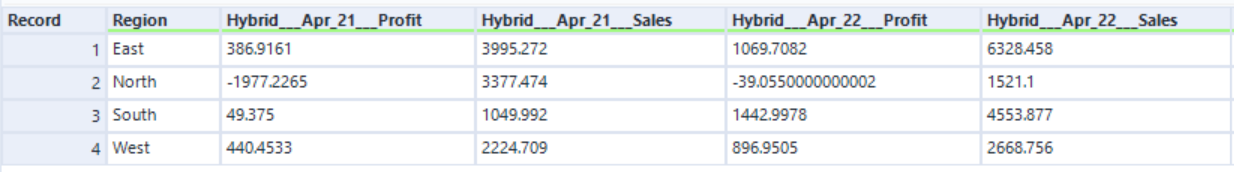
To do this, in the configuration pane, there is an option called 'Change Column Headers'. This should be used to select the field where the new columns want to be split from. The option directly below is 'Values for New Columns', which is for selecting what corresponding value will be in the new column. The next option is to decide how the values selected will be aggregated, ie, sum, average, max, min, etc. The top option should be selected if the fields want to be grouped in the new table.
See the examples below to understand how the data is split and moved and what options have been selected.