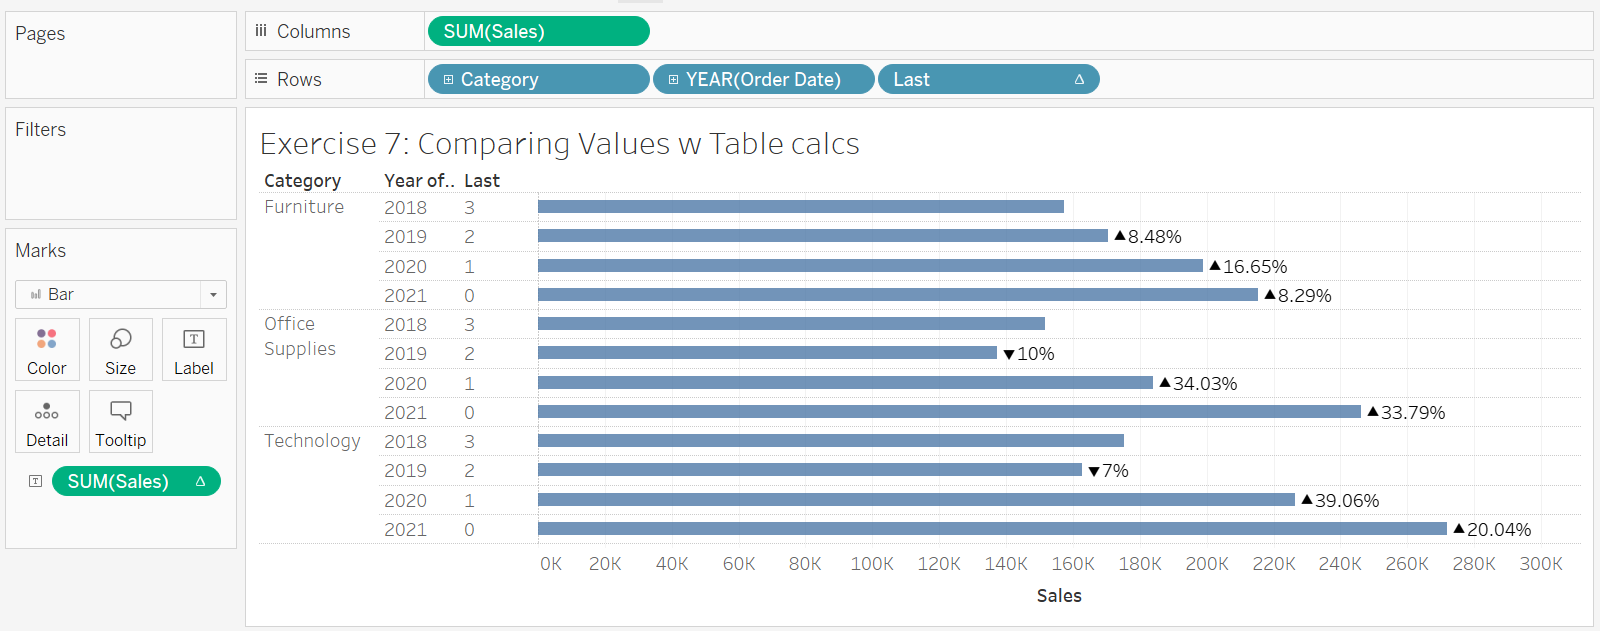
It is possible to use a table calculation (or even a calculated field) to compare two values in a chart. Using a table calculation will remove the need for writing a new calculated field for each section of the data. By nature, a table calculation will go down a pre-determined number of rows before (or after) the selected row and use these values. This, however, wont be dynamic, meaning if the data is updated, the calculated field(s) will have to be re-written. The example which will be used will look at percentage difference in sales for different years. This will require bringing in data for multiple years, but we only want to show the year in question, see picture below.
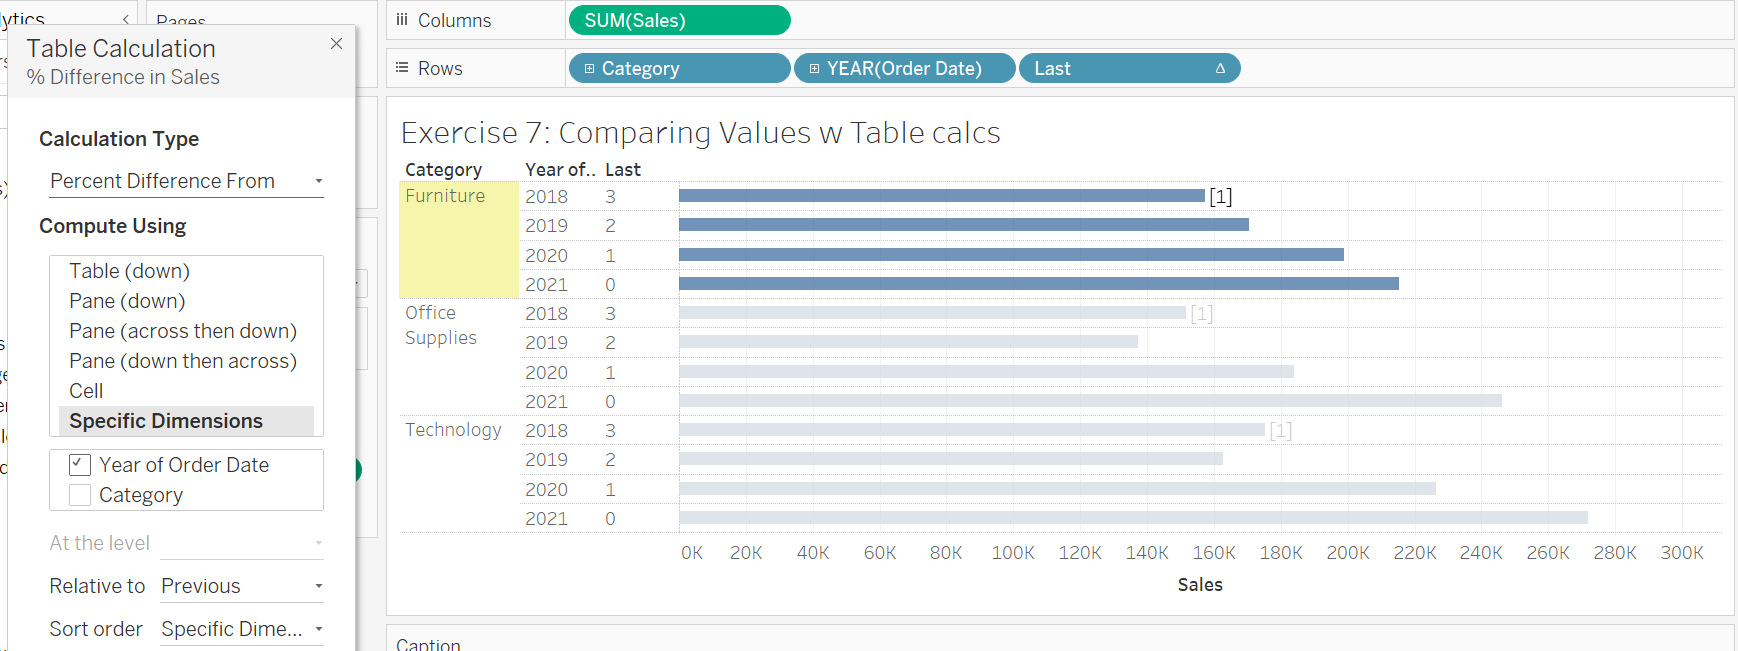
When creating a Table Calculation, the computation of the calculation can be determined by selecting various options from the menus. Importantly, the specific dimensions allows you to select a category to group the calculations by. In our example, we could calculate the percentage difference between each category, or each year. It depends on which values are ticked and the order in which they appear in the specific dimensions pane. Put this table calculation for the SUM(sales) on the Label on the marks card, to make the value appear at the end of the bar, some formatting may be required.
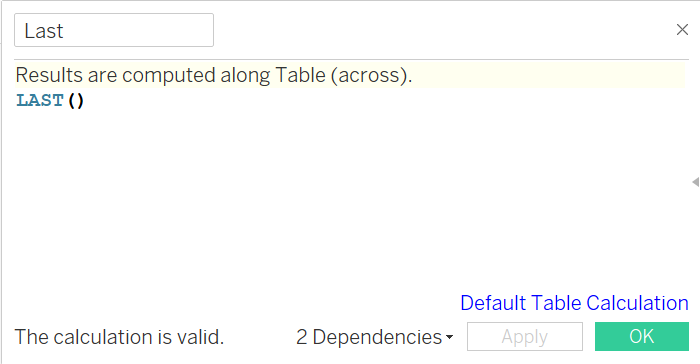
To make this dynamic, and to clear up the chart so it only shows the most recent year, filters must be used. If we make a calculated field to dynamically number the rows in each section of data, we can use a filter to always select the newest number in the list. If we number the newest rows as zero, we can filter for just the rows numbered zero. The LAST() function can be used to do this. Simply create a calculated field with LAST() inside. Put this on rows to assign numbers.
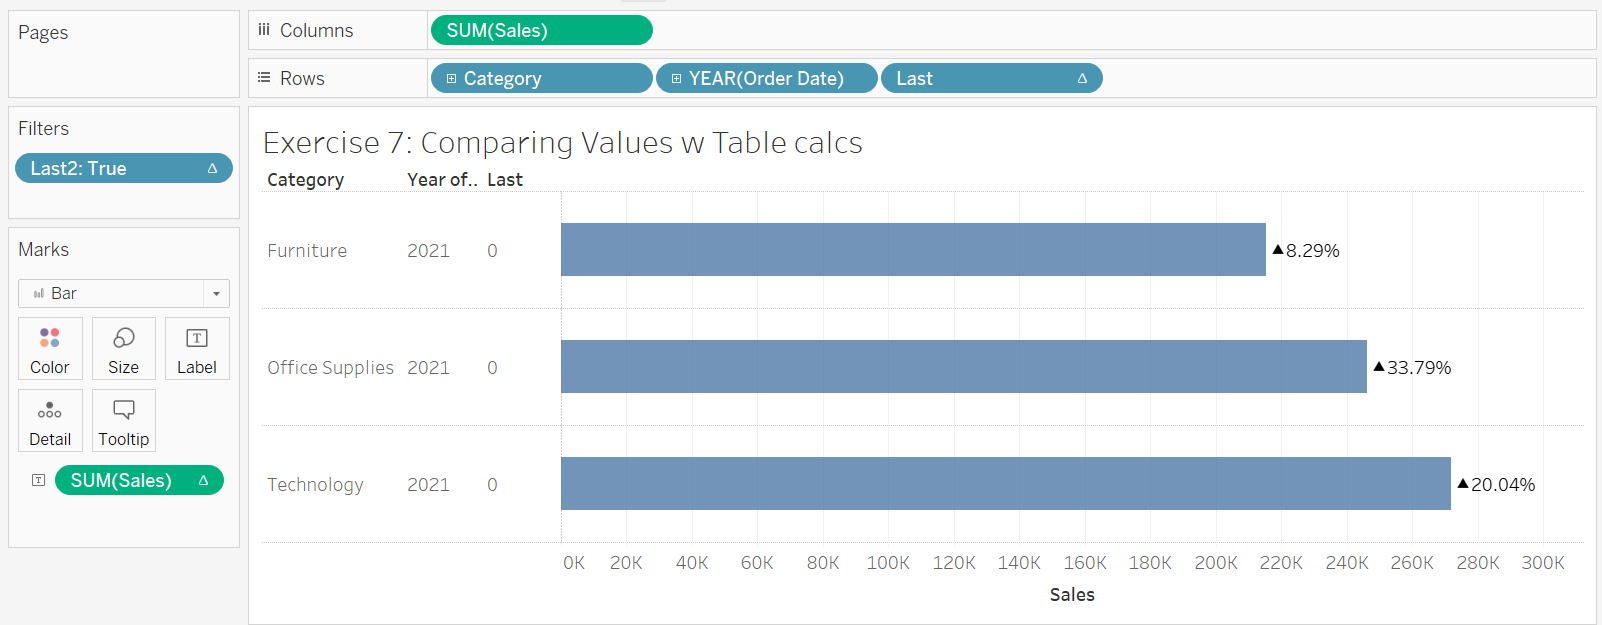
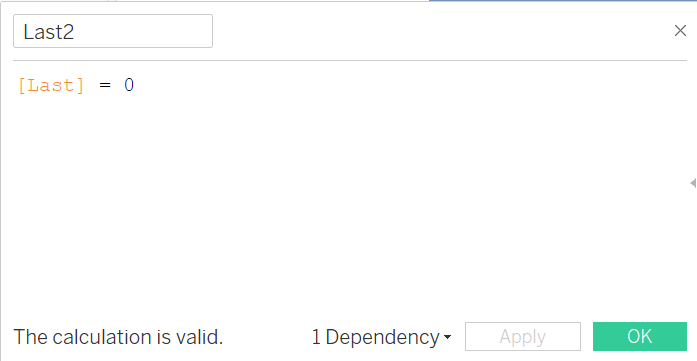
A second calculated field must be created to decide which rows are to be selected. As the most recent year is needed only, a calculated field deciding if the previous Last calculation = 0 is needed. If the last two are needed, [last] <=1, and so on for more years.
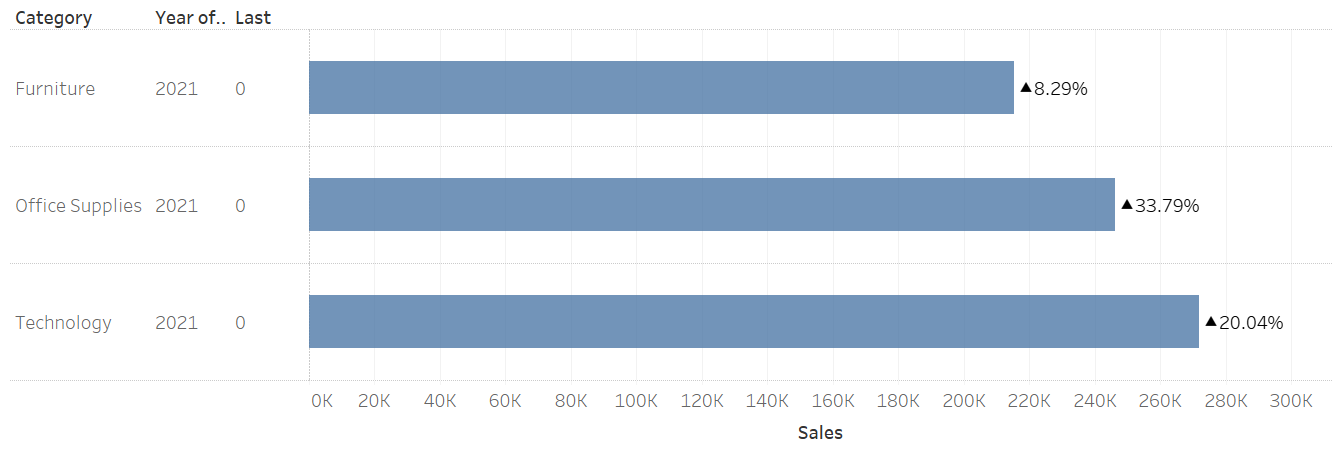
Put the second calculation into the filters card and select true values only. This should hide the previous years whilst still using them for the table calculation to calculate percentage difference.