


Parameters are useful to the user because they can be changed inside the dashboard, changing the information showed on charts. This is especially useful when trying to make predictions and comparisons quickly. This is a short guide how to create a parameter to show an increase in profit over time.
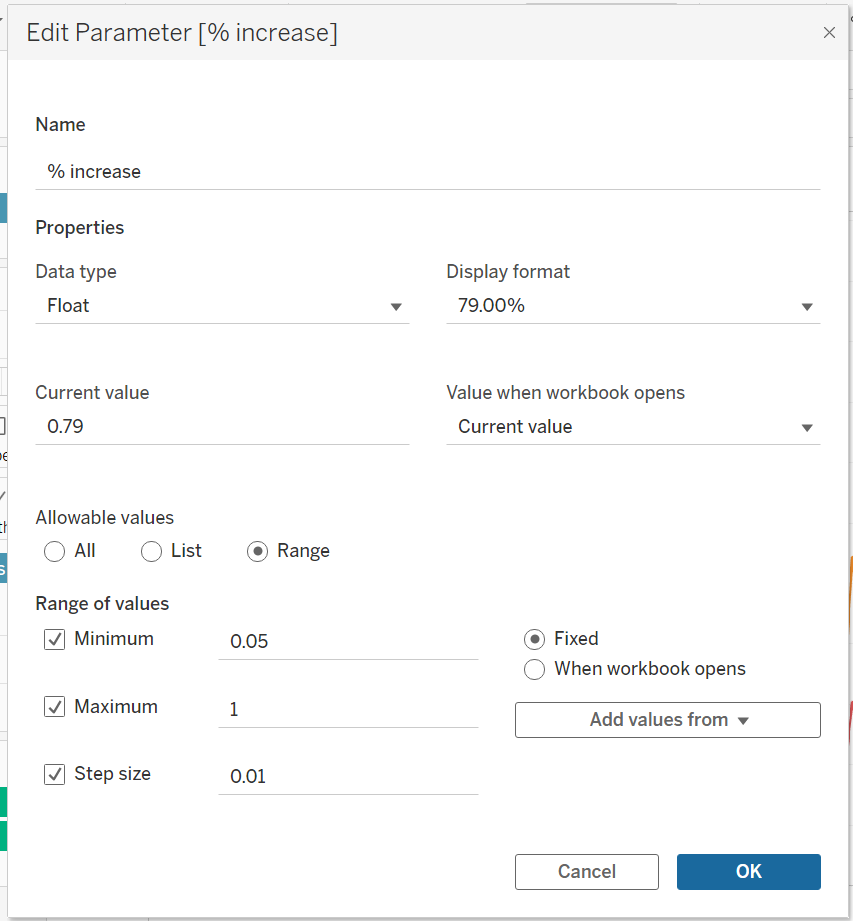
Firstly, create a parameter and name it accordingly. In this example we are looking at a percentage increase, so select the correct data format and type, and build the range as desired. After it is completed, right click the parameter and select show, so it appears on the workbook.
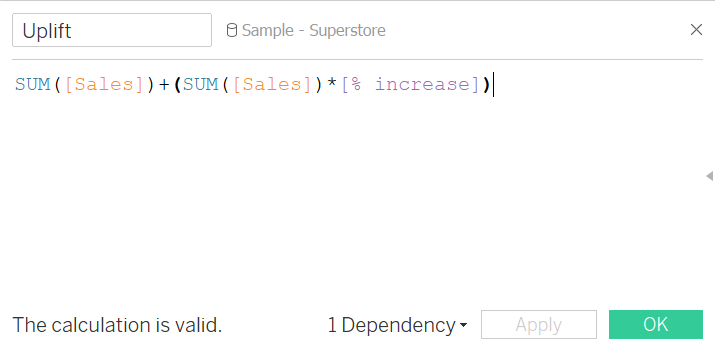
Secondly, make a calculated field. The calculated field will calculate the uplift using the information input into the parameter. The example below shows multiplying the SUM(Sales) by the percentage increase and adding it to the original SUM(Sales). If a downfall is required, the percentage change should be subtracted from the SUM(Sales).
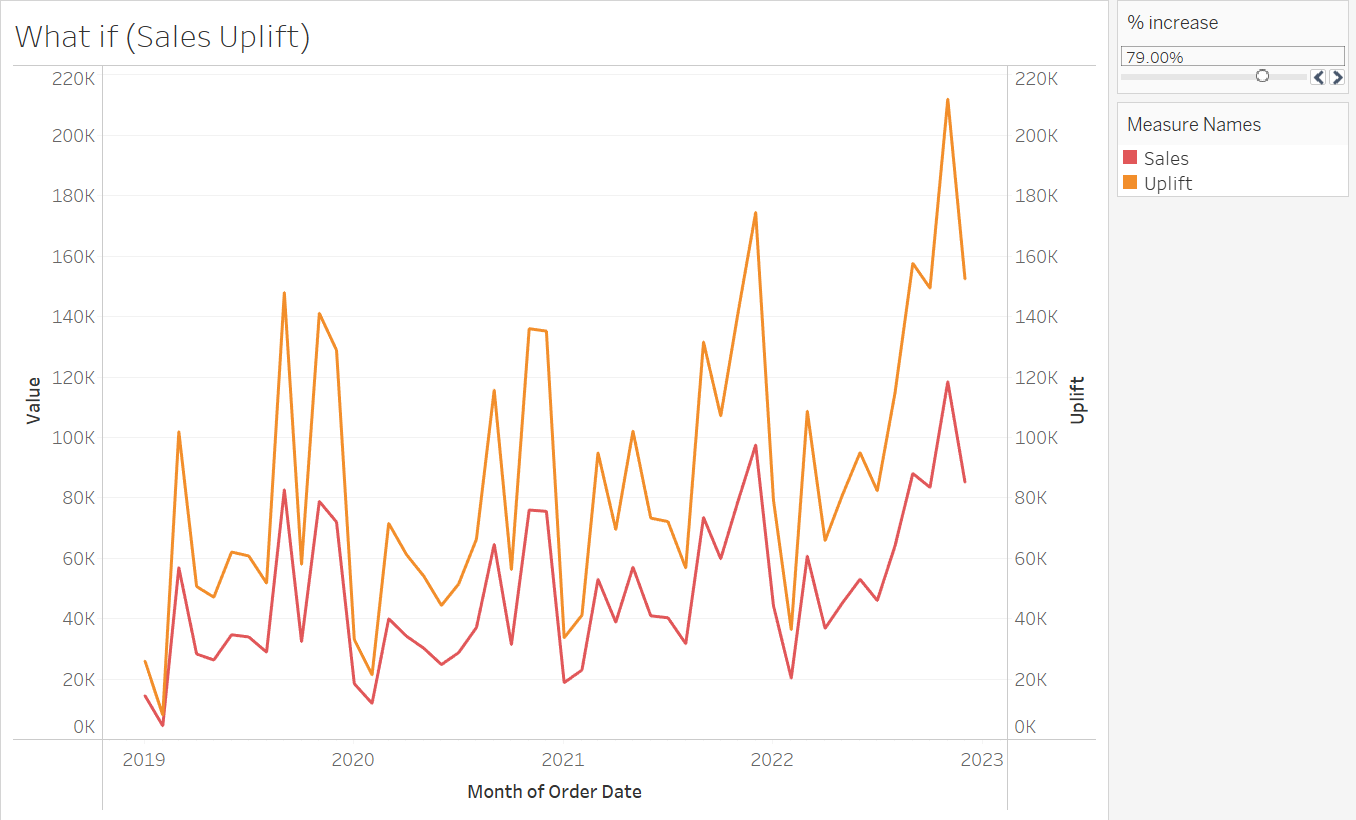
The best way to show Sales over time is on a line chart. Create one by putting Sales on rows and time on columns. We must then put the newly changed data onto the chart so it is easy to compare. Do this by dragging the calculated field for uplift onto the rows. Dragging the Uplift onto the Y axis will ensure the field are scaled the same and put the lines on the same chart. Colour the lines accordingly to distinguish.
Change the parameter to check the chart changes. Multiple parameters can be used on the same chart, for example to show uplift and downfall. Once working, it is easy to see how useful this could be when explaining data and predictions.
Beau Foletti | DS33