For the last day of dashboard week we have been tasked with creating a KPI dahsboard or an infographic to look at the results of the 2016 European Referendum.
We only had 2 1/2 hours for this task so \i made a quick choice to go with an infographic as i thought i would be able to have a bit more freedom in design with this option.
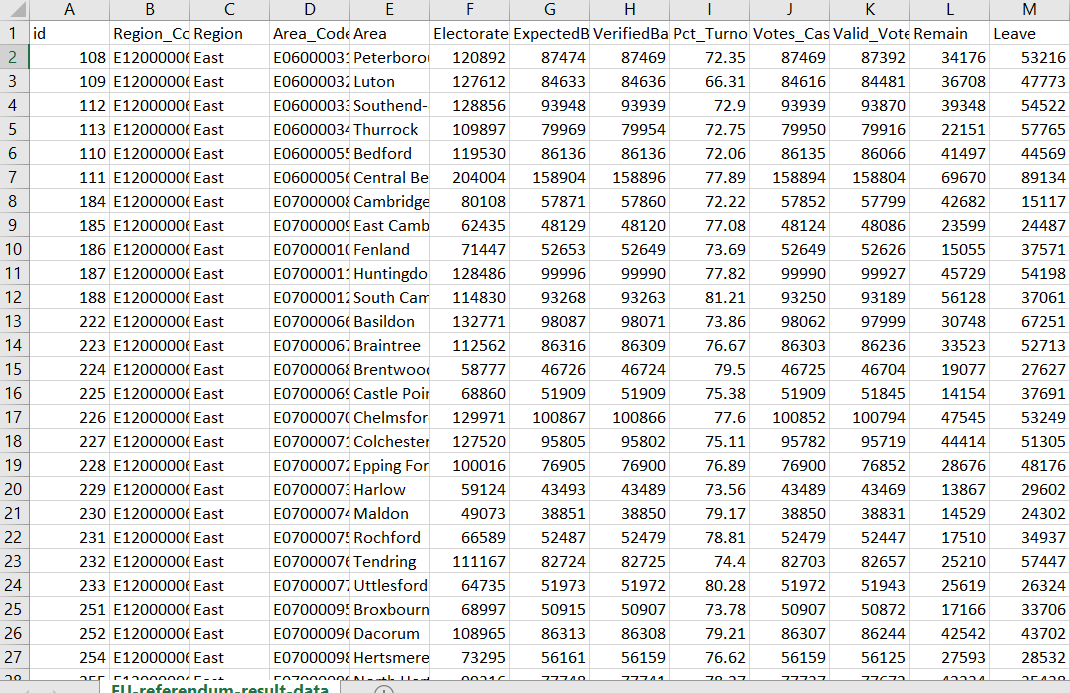
The first port of call was to look at the data and see what we had to work with. Luckily it was a pretty clean dataset and didnt really require any work before putting into Tableau.

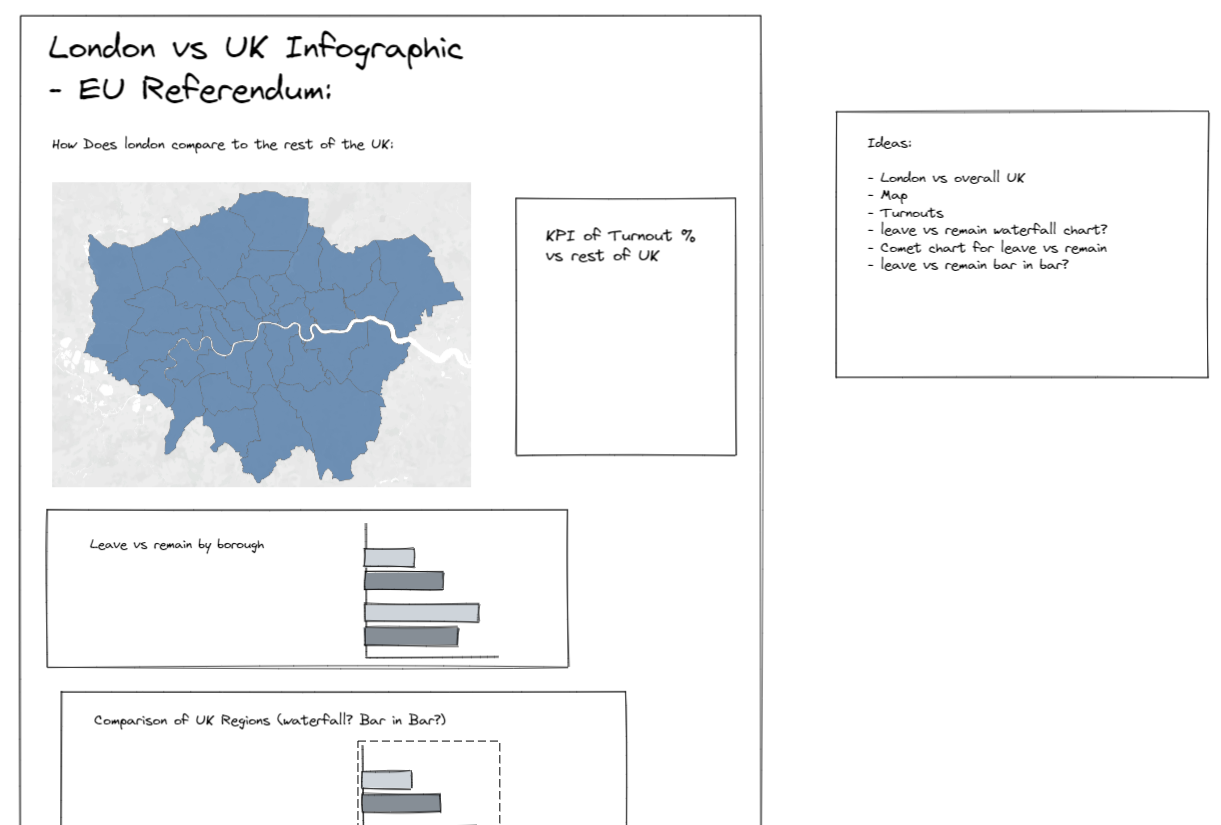
Once I had decided what I wanted to create I made a quick sketch in excalidraw to get a rough outline of the infographic so I had an end goal in my head.

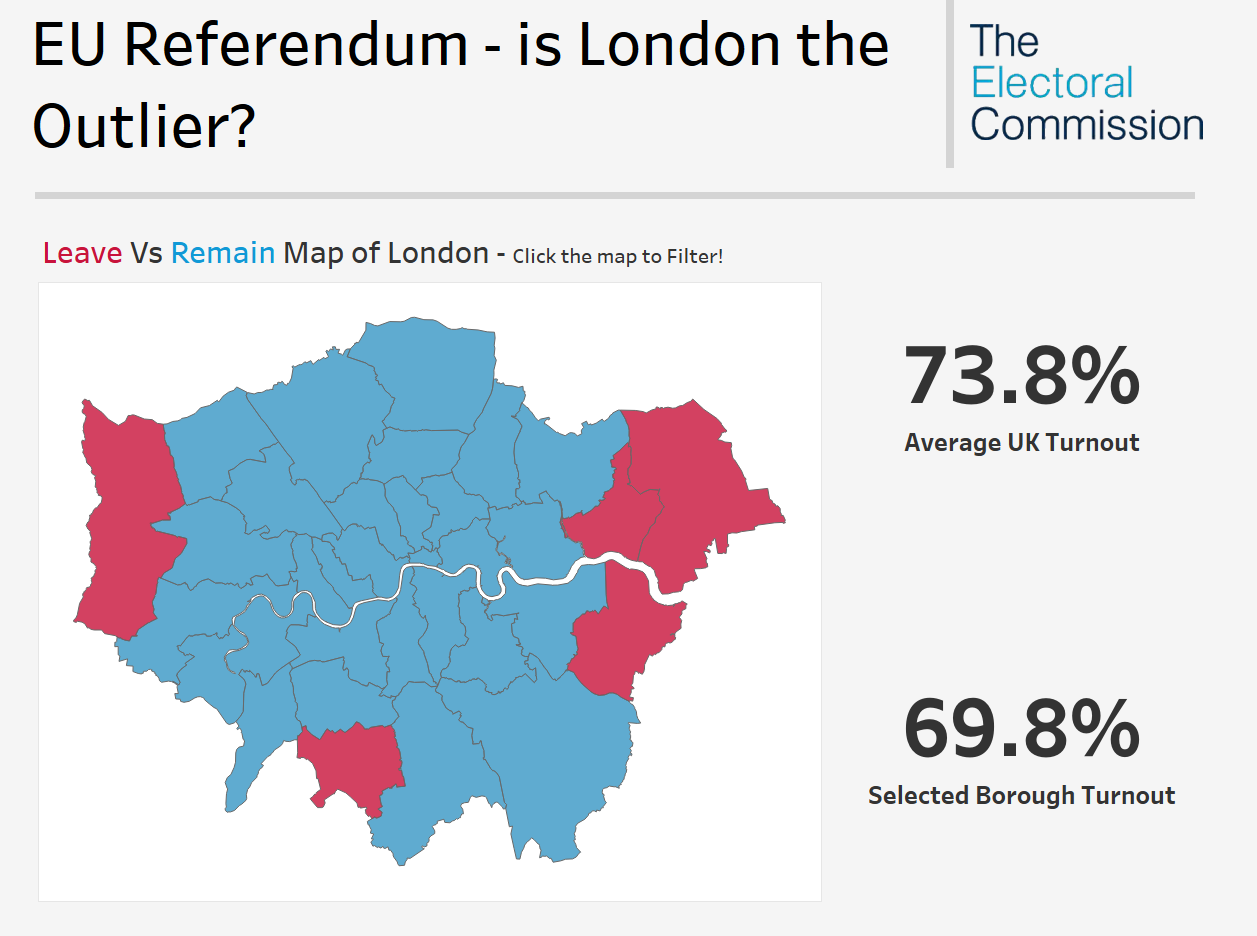
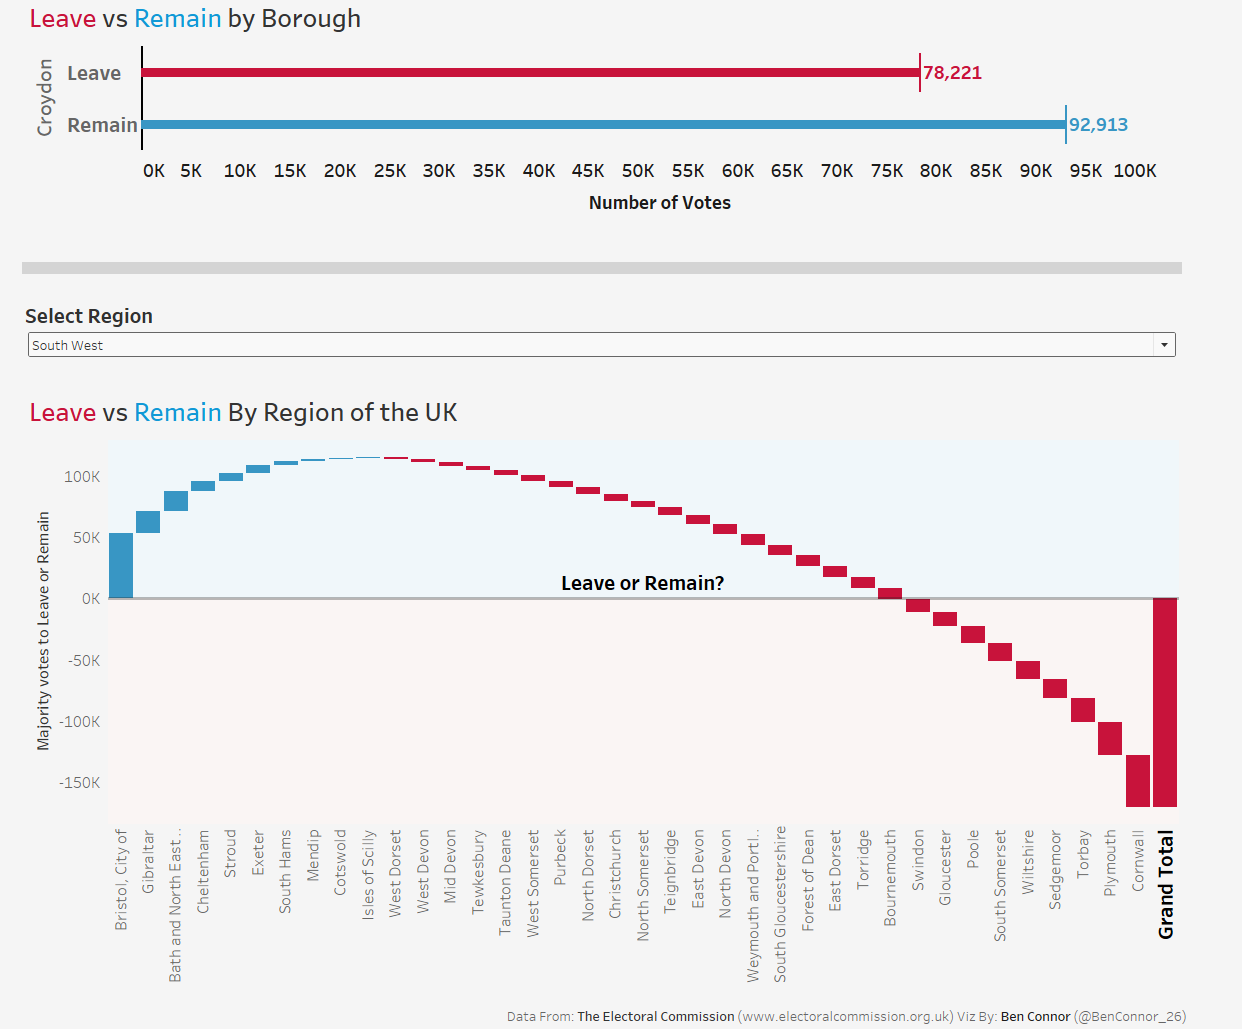
Now I had decided what my goal was I began to design the infographic with my main focus in mind being the comparison of london vs the rest of the UK. The time pressure was probably the most challenging part of today as we only had just over two hours to go from start to finish as well as write this blog post.
I'm fairly happy with how it turned out but there are definitely things that could be improved on.


