It's the second day of the dashboard week - the week where we get a task every day which we have to solve. The task from our first day was pretty cool, what I did can you read here.
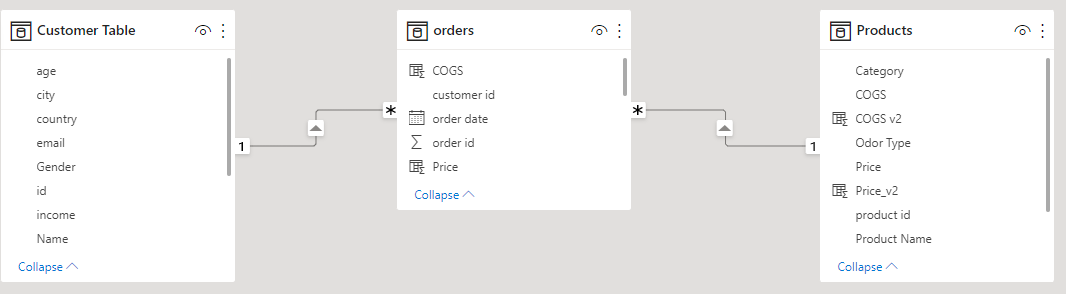
The on our second day was a dashboard in PowerBI with several requirements regarding the data. But there were no data provided to us, we had to create our own data with Mockaroo. I decided to create sales data from a fragrance D2C brand which I called BLISS. The data contain several dimensions like category, size of the bottles and an odor type. Moreover I created a customer table which contained data like age, gender or location.
Mockaroo provides the possibility to create a table schema with foreign keys, so my data model in Power BI looked like this at the end:
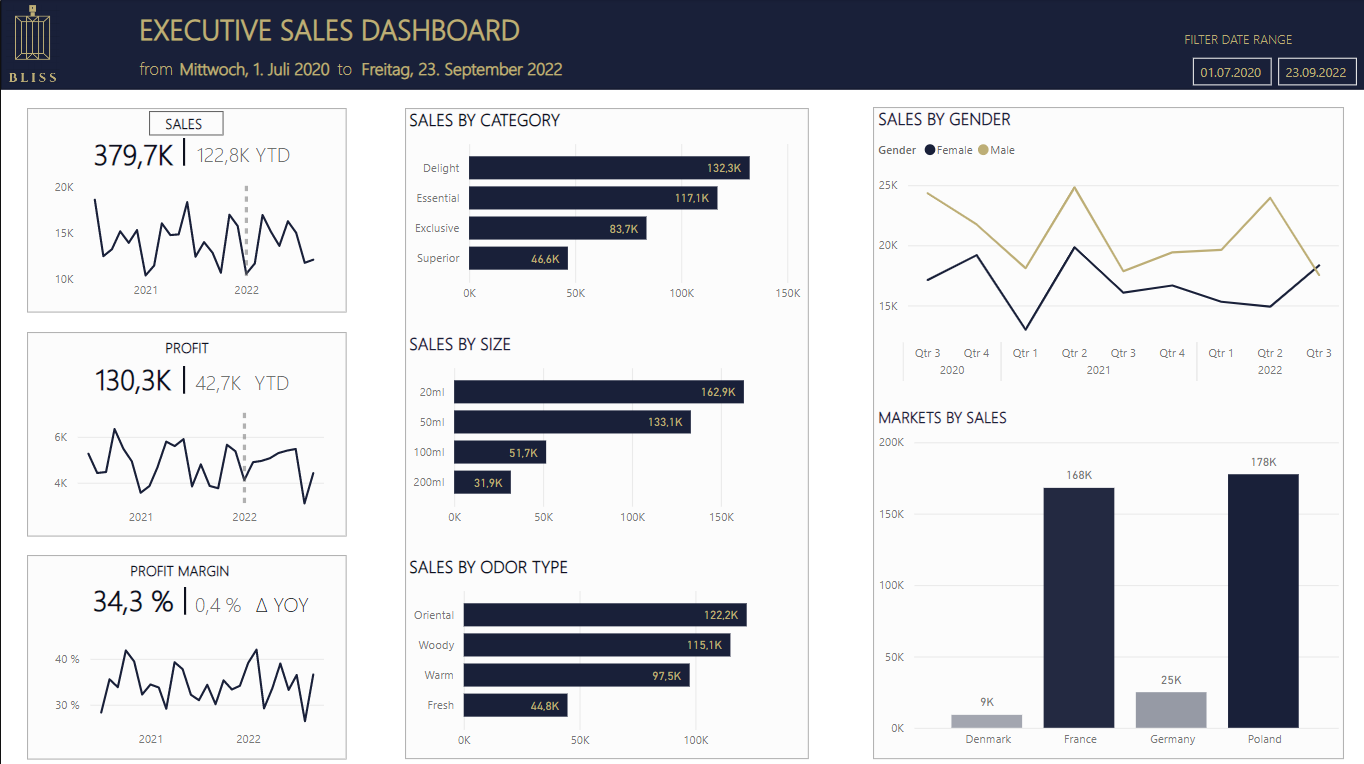
I decided to build my dashboard for a sales excecutive who wants to get a quick overview about different sales KPIs abd a brekadown of these onto the dimensions I described above.
To build an expensive looking dashboard was a plan which I had a long time on my mind and this fragrance company was the perfect opportunity. So I went for a very dark blue and gold as the colors.
At the left side are some KPI cards with sparklines, in the middle sector is shown what the people buy and on the right side who is buying the products. Gender is an important indicator in the fragrance industry so this is very popular placed on the dashbord. Moreover there is the possibility to the user provided to change everything besides the KPI cards to "Sales", "Profit" or "Profit Margin" just by clicking on the header in the KPI cards. Not a very intuitive way, but if you use the dashboard frequently, like a sales executive does, it works when it is clear and explained. Power BI has on default a filtering over every chart enabled which i kept on.
Here is my final dashboard: