The Friday of our second week was project time again! We worked together in pairs. I had the opportunity - and pleasure - to work with Ozlem from the DS 32, how we spent our day can you read here in her blog!
Our topic was reshaping of data, i.e. pivot und un-pivot data in Tableau prep and Alteryx. In the following I want to explain:
- use cases for pivot and unpivot
- how to pivot and un-pivot in alteryx (transpose and crosstab)
- how to pivot and un-pivot in prep
Lets go!
Use cases for pivoting data
Use Case Pivot
Sometimes data are not structured in a way you might expect or have the wrong shape to analyse it properly in a tool like Tableau. For example you want to analyse the GDP of countries over several years. You happily download the file and then when you take a first glimpse on the data you see something like this:
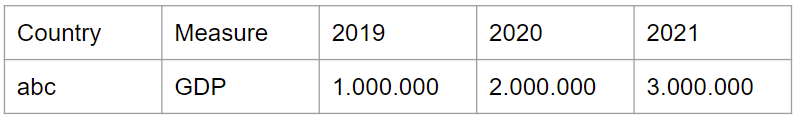
In one row is the name of the country, the name of the measure and the values of these measures, one measure per year and every year is a column. This is very easy to read and we can compare the GDP of this country easily. But if we want to import the data in Tableau, we have a problem. Every year is one measure and it's arduous to analyse this data. So: what to do? Answer: Pivot respectively Transpose (Alteryx). The problem we want to solve is, that we have column headers which are variables, not values itself. What we want to do is to take these column headers (which in truth are values) and bring them in one row. The symbols of the corresponding tools in Prep and Alteryx indicate the move the column-headers do.

The result looks like this:
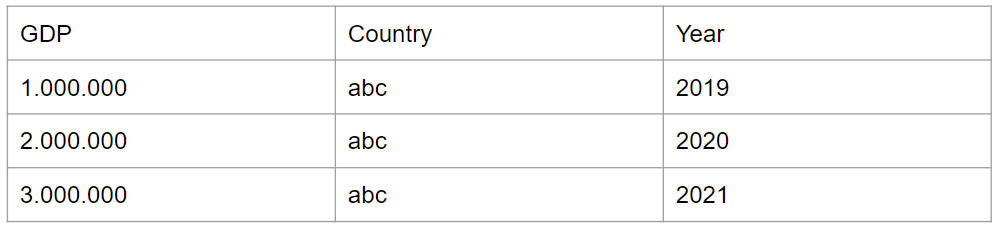
So the difference is very clear. We don't have one column for every year anymore, instead we have one column which is called 'Year' and this column contains all aour years. So now every observation is one row. The GDP corresponds in it's own column to the year in which it was measured. This is more tidy and a way better shape of the data to analyse them.
Use Case Un-pivot
There are not many use cases as far as I know for un-pivoting data, or the Crosstab tool in Alteryx. One use case could be, to bring the data in a more intuitive table form to read for humans. But the structure, how you transform the data is basically the same, just the other way around.
The starting data are the output from the pivot above:

What we want to do is again indicated by the symbols in the data prep tools. Unique values from a column become in the result headers.

The result look like this:
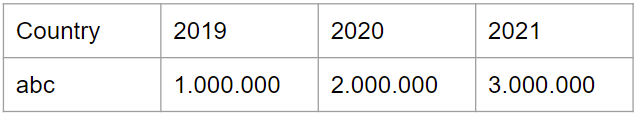
All the unique values in the the 'Year' column are now column headers.
How to do it in Alteryx
Pivot
Warning! Pivot is Transpose here!
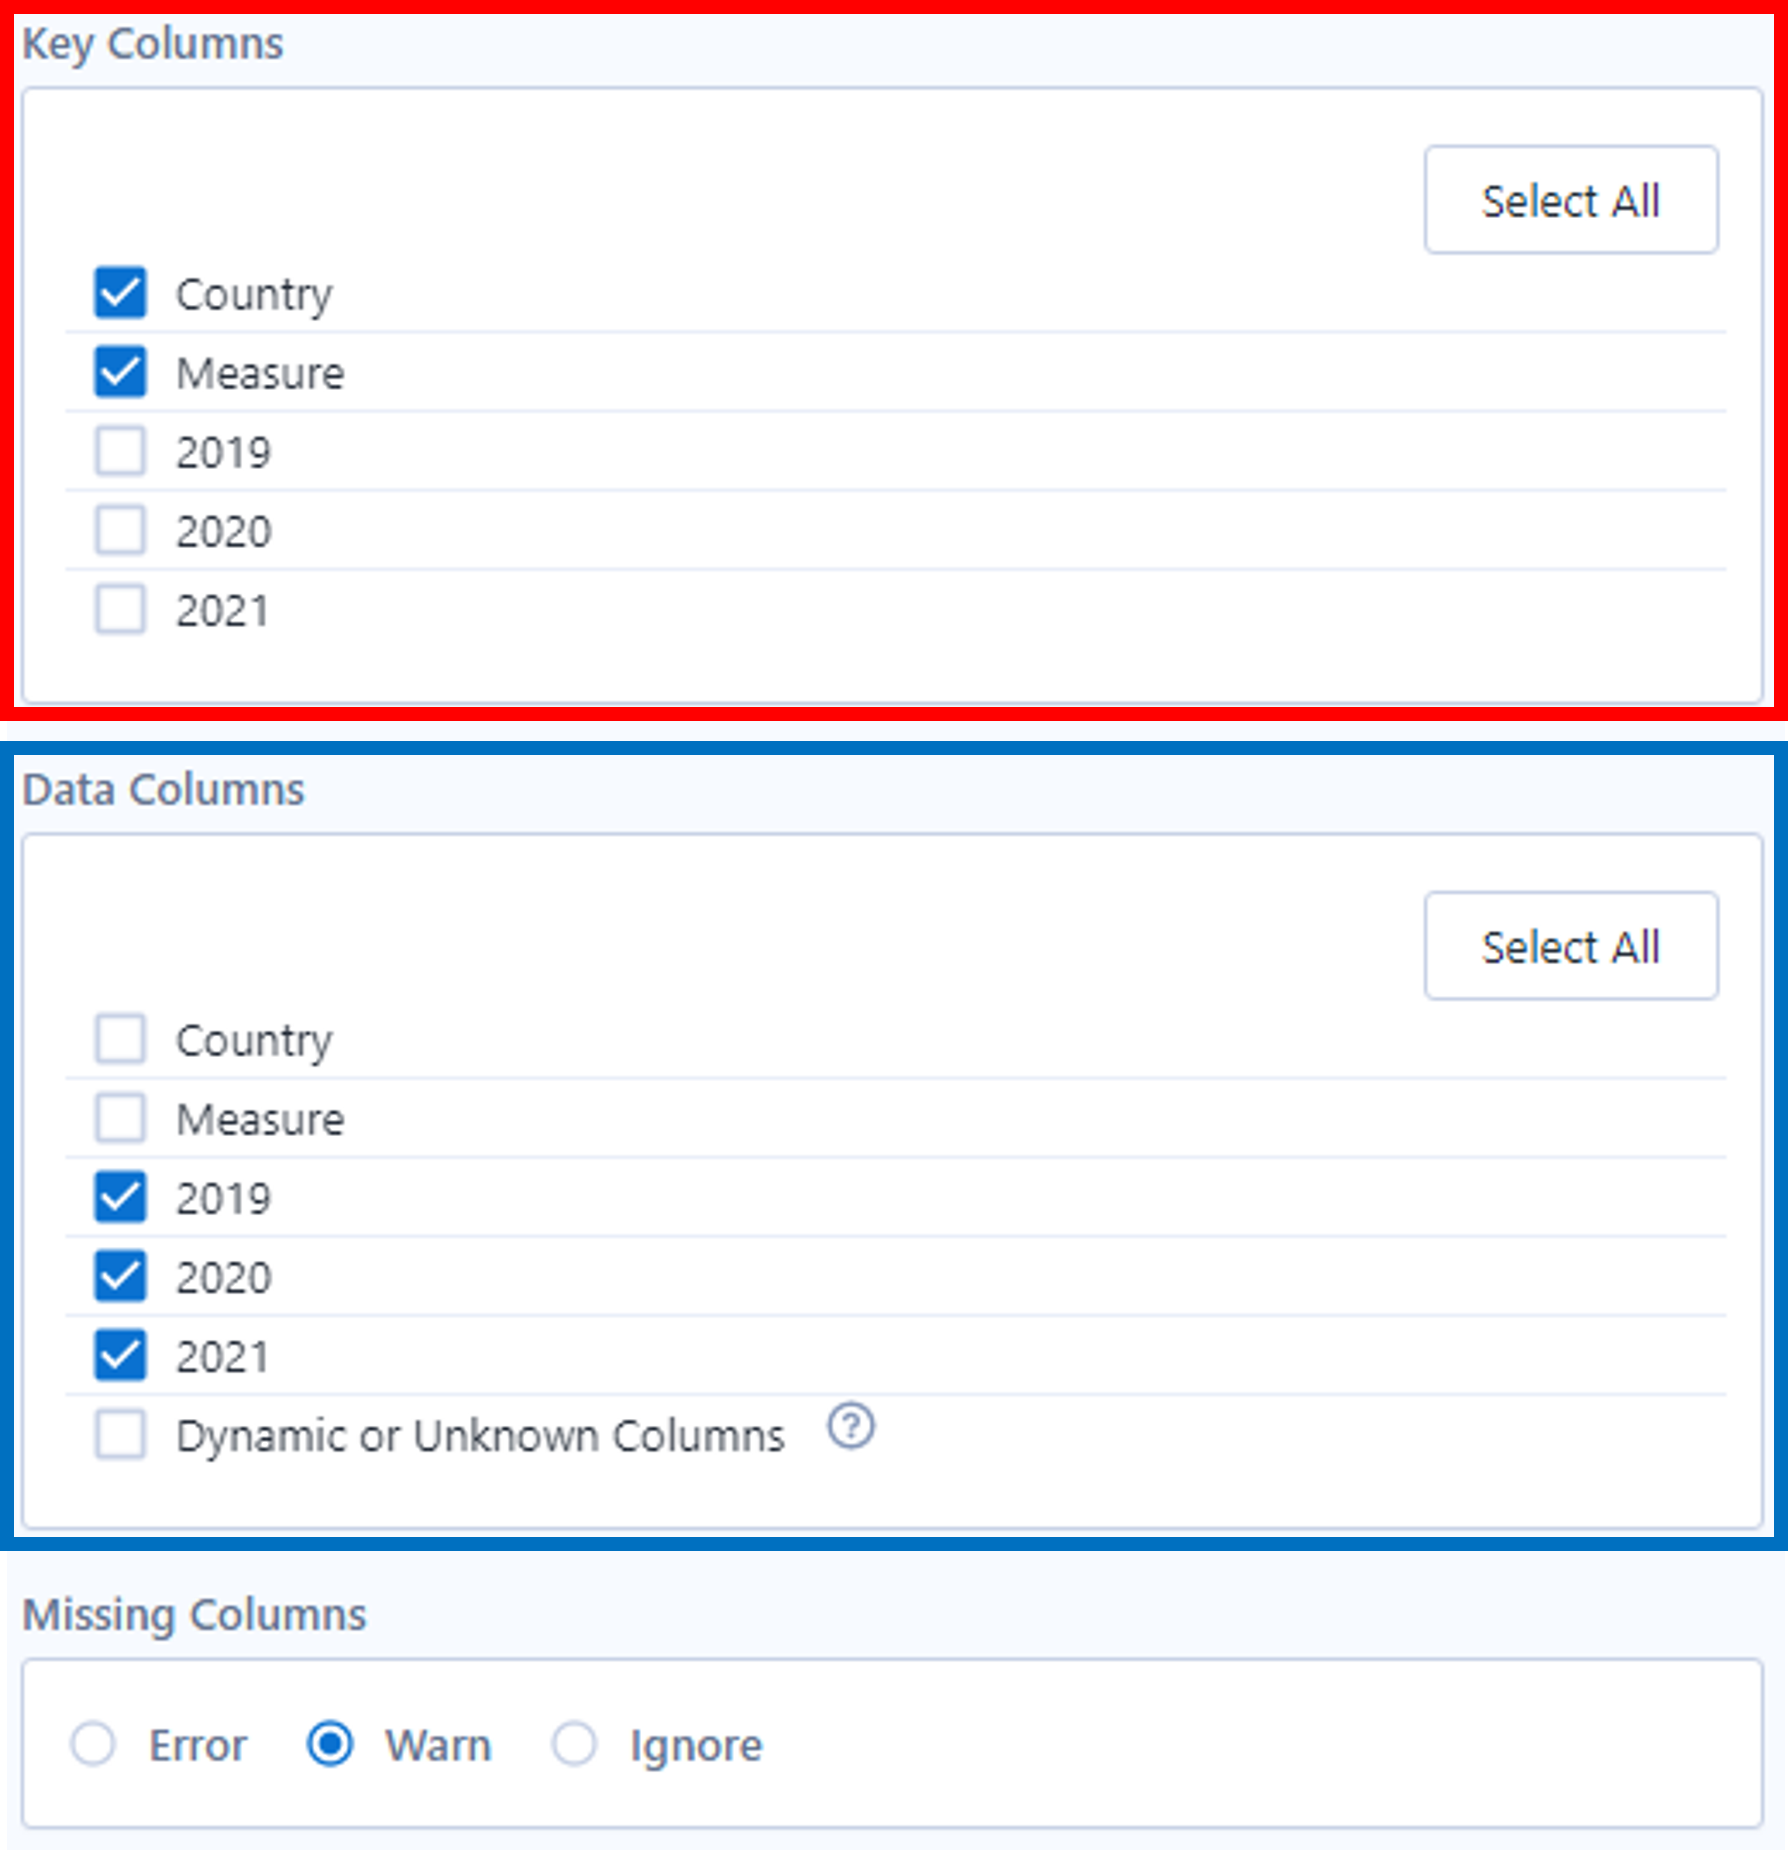
You find the Transpose tool in the toolbar under the header 'Transform'. If you put the tool on your canvas you get on the left several options:
-
Columns that stay
-
Each combination of key column and columns to be transposed gets one row
-
Columns which contain the data
Un-Pivot
Again a warning! Un-pivot is Crosstab in Alteryx!
The Options of the Crosstab tool look like this and have the following options:
-
Columns are not changed
-
Level of detail you group the data
-
Works like 'group by' in the Summarize tool or in SQL
-
The column whose values are to become column headings
-
Values that should be in the newly created columns from change column headers
-
Aggregation type of the selected measure - like in the Summarize tool
How to do it in Tableau Prep
Pivot
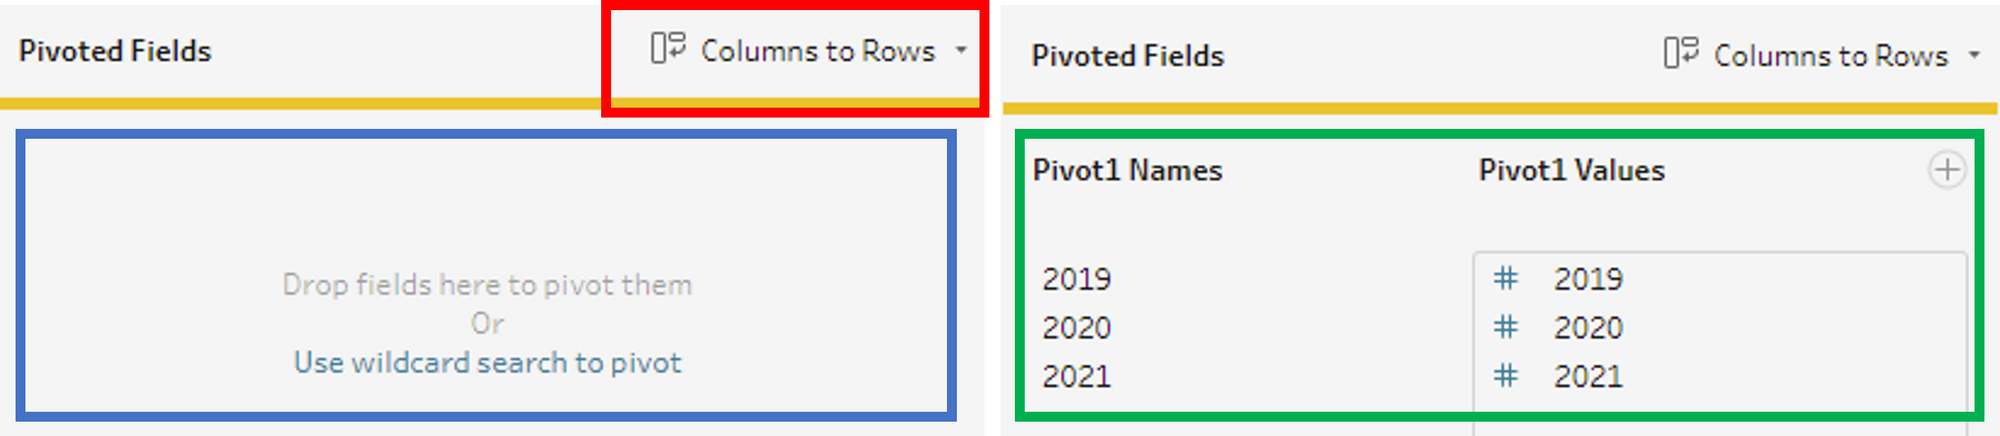
For both, pivot and un-pivot, you use the pivot tool in prep. The difference between pivot or un-pivot can you choose here.
- Drag and drop the columns you want to turn into rows
- Result if you dropped the fields - Pivot1 Names is the column which contains the values from the column headers, Pivot1 Values conteins the values which belonged to the pivoted columns
Un-Pivot
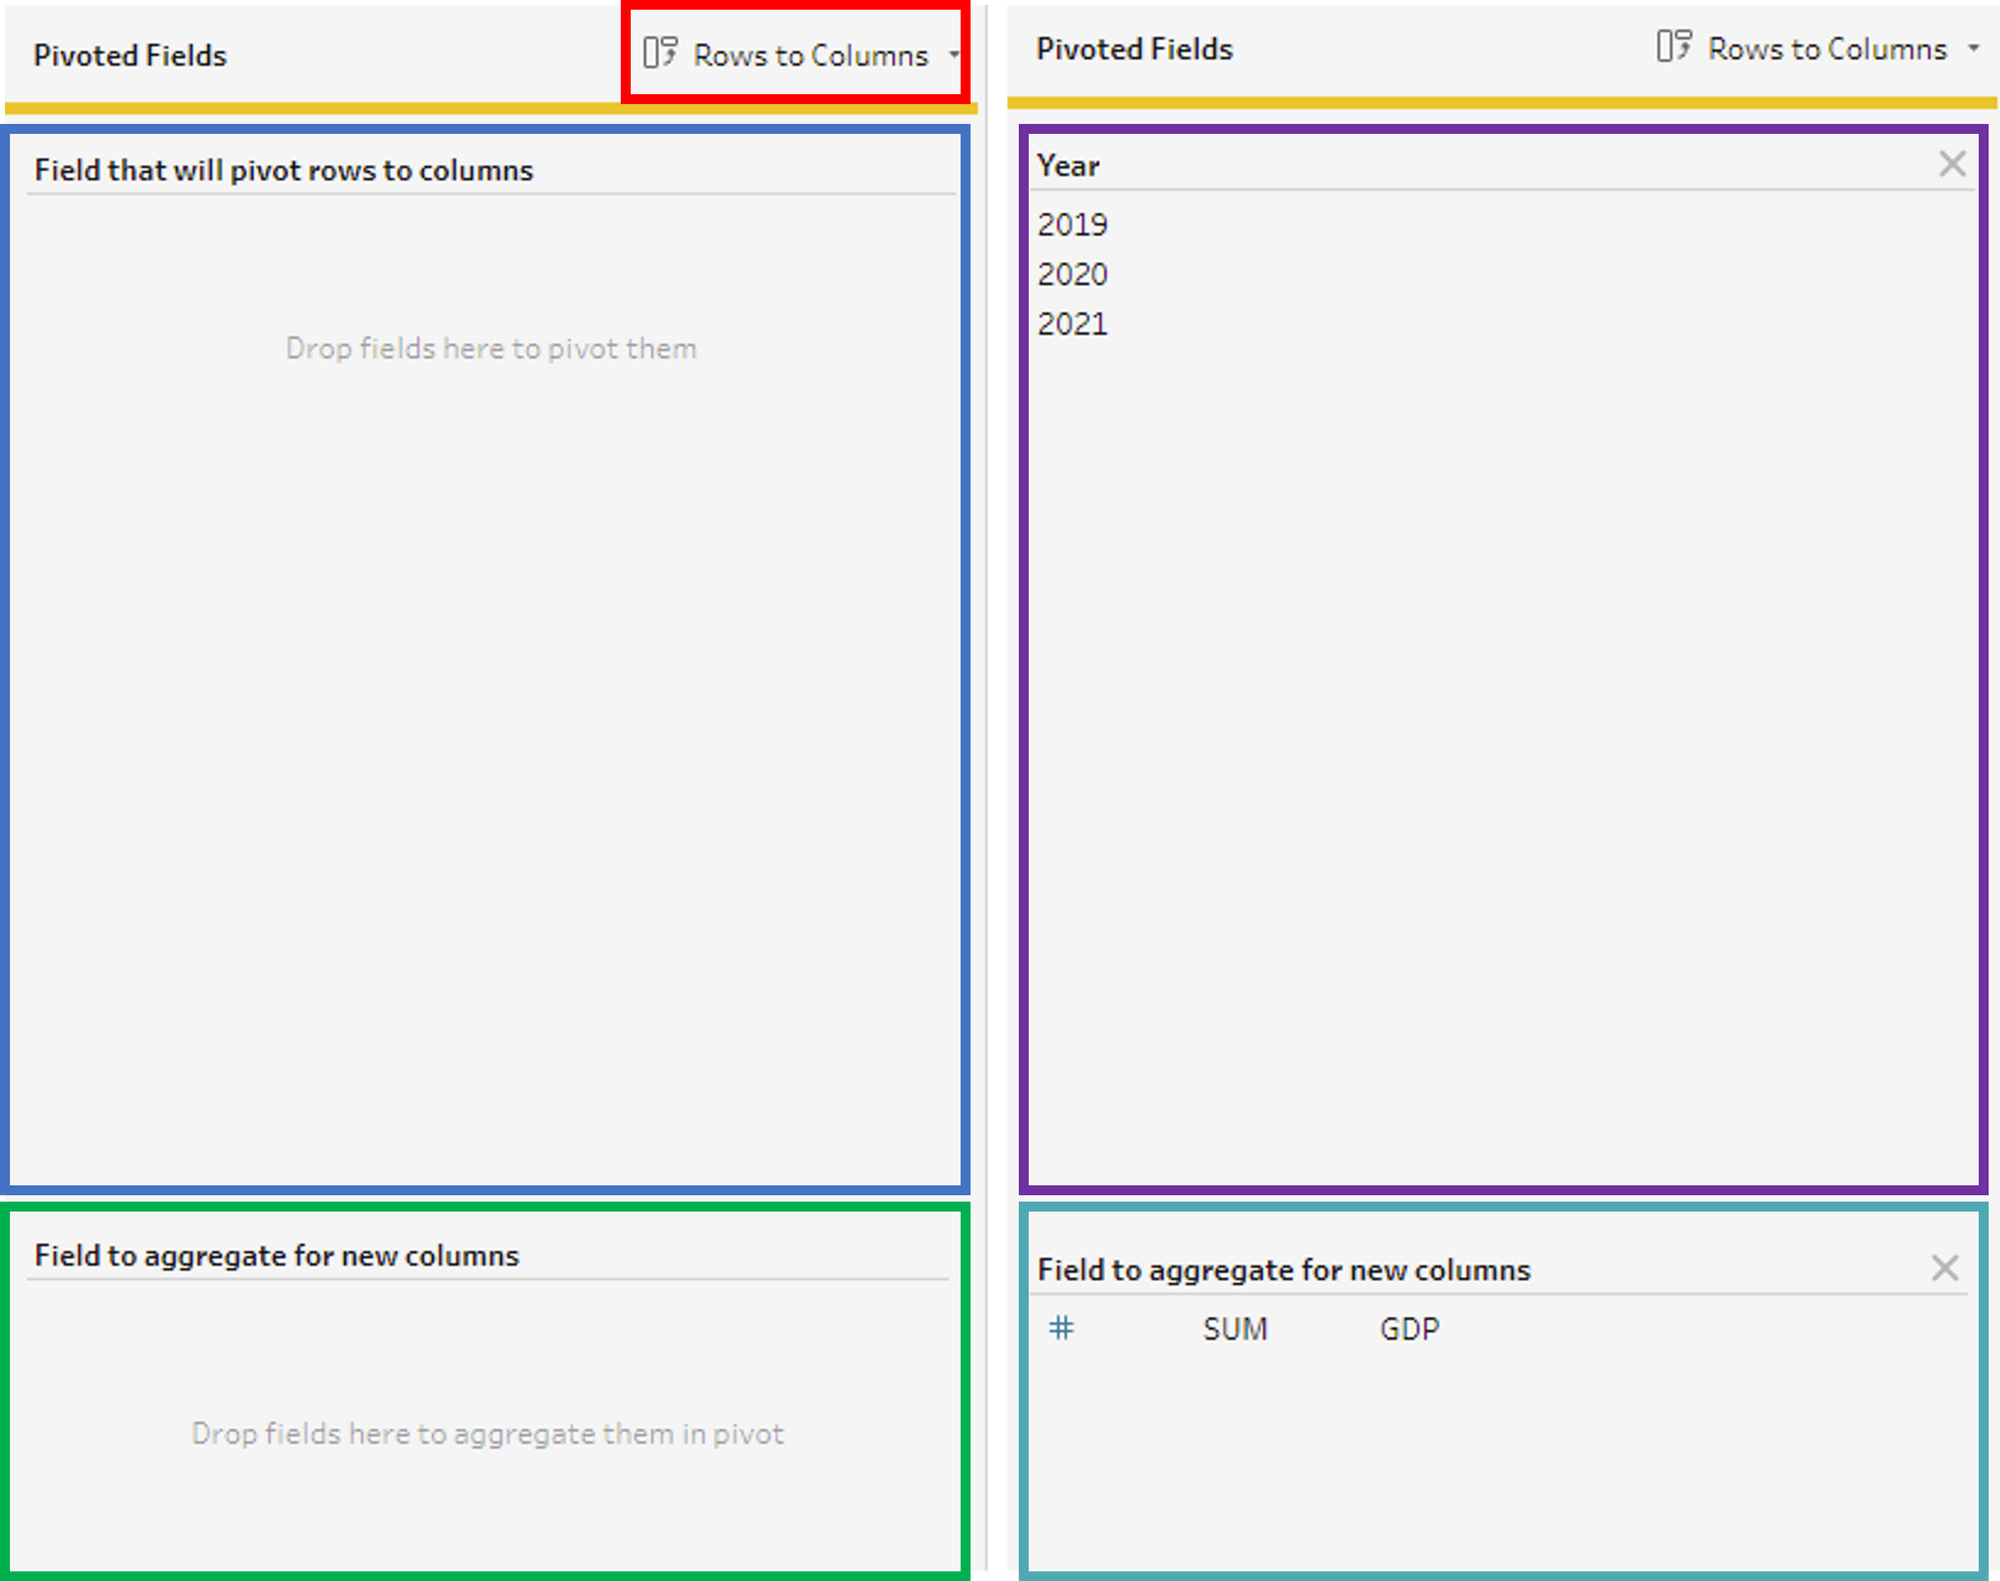
To un-pivot data you have to select here 'Rows to Columns'.
- Drag and drop the columns you want to turn into column headers
- Drag and drop the columns which contain the values you want to aggregate and insert into the new columns
- These years become our column headers
- We want the GDP into the new columns aggregated as a sum, other aggregations are possible too