


Earlier in the week I posted a blog on my first adventure with R.
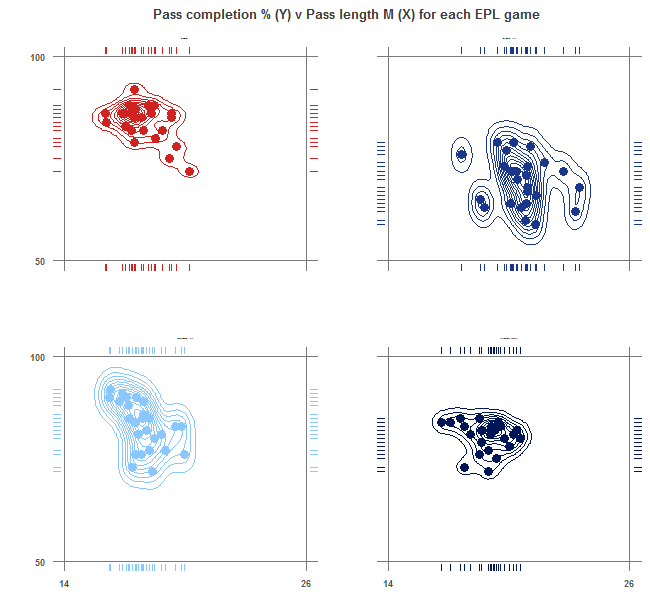
Well today I took this a step further and tried (successfully) to transfer the code I wrote to create the below visualisation into the alteryx R tool to see if I could produce the same output.
I’m going to use this special ‘From R to alteryx’ post to show you how I went about doing so.
So the first thing I tried was to drag the R tool into my workflow, point my input at this R tool, placed a browse tool as the output and copied in my code and pressed run. It didn’t work. But using the results pane I could use the error messages to help diagnose and subsequently solve the issue before trying again.
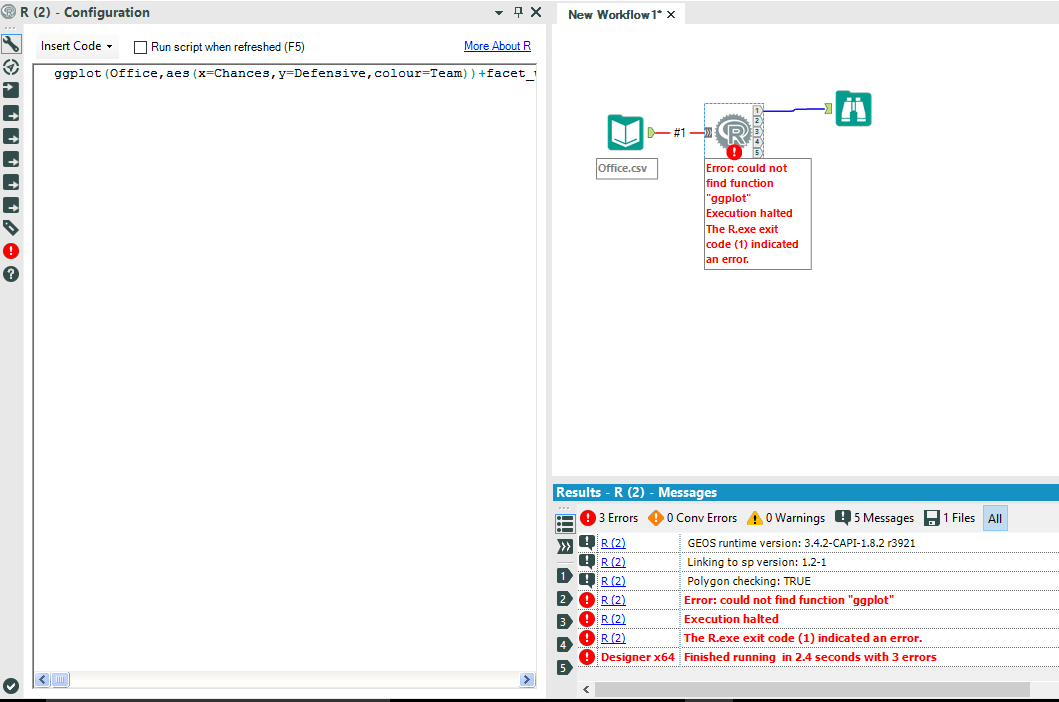
So I got an error saying ‘could not find function “ggplot”.
Okay, so I suddenly thought to myself, well actually, the R-tool in alteryx might not actually support the ggplot2 package.
I did a quick google and found this page on the alteryx community, which suggested ggplot2 was not yet supported. This blog post is however 18months old.
I scrolled through the responses and came across a user who suggested copying the ggplot2 package installed on R-studio into the location where the packages are installed with alteryx (C:\Program Files\Alteryx\R-3.2.3\library). I did this, but when I pasted it into the R-folder in alteryx I got a duplication error, there was actually already a ggplot2 package in the latest version of alteryx.
Ok, so something else must be going wrong. Another quick search and I landed on this page (a bit more recent, only three months) as an alteryx knowledge base article.
To summarise the article we need to write a script within our R-tool (prior to the ggplot function being called) that installs the ggplot2 package.
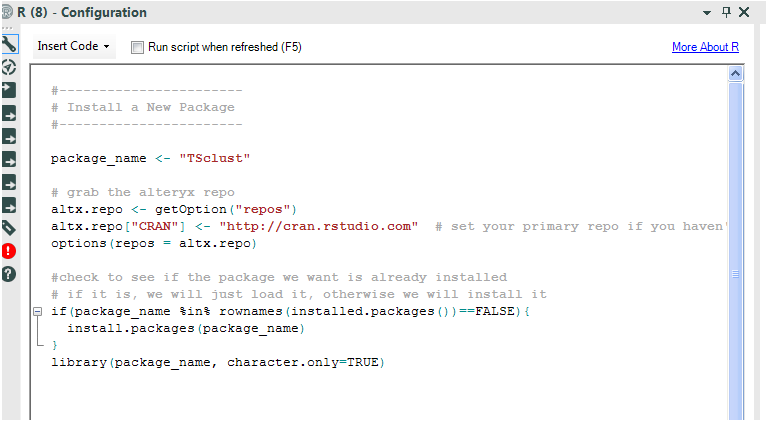
You simply change the name of the package to the one you wish to install… in my case changing “TSclust” to “ggplot2”. I made the change and re-ran the workflow…
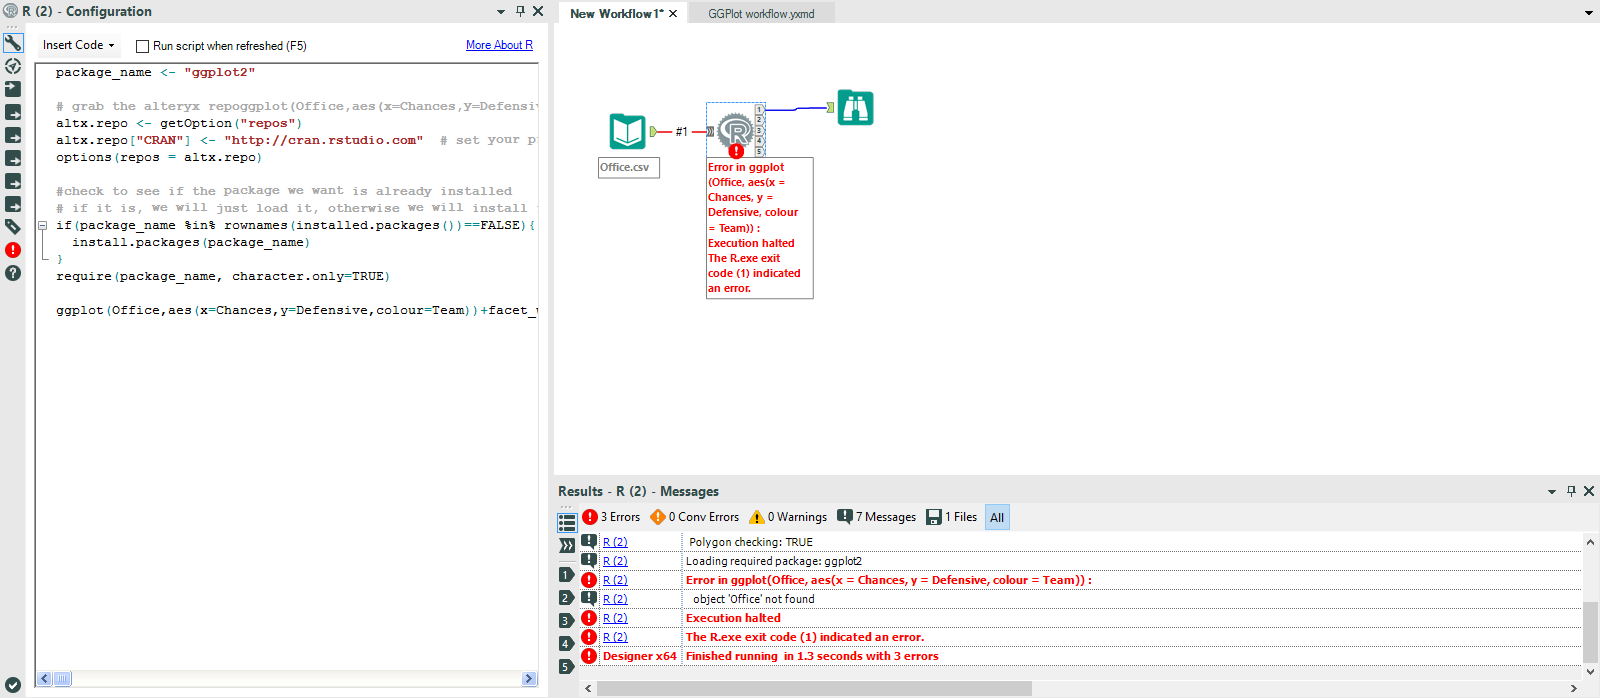
Ok, an error, but a different error! The good thing was that the error appeared to have moved passed the calling of the ggplot function (meaning that part was OK).
Further inspection shows that the ‘object ‘Office’ not found’ (just to clarify here, my data set is called ‘Office’). So I now know there appeared to be a problem with the Input.
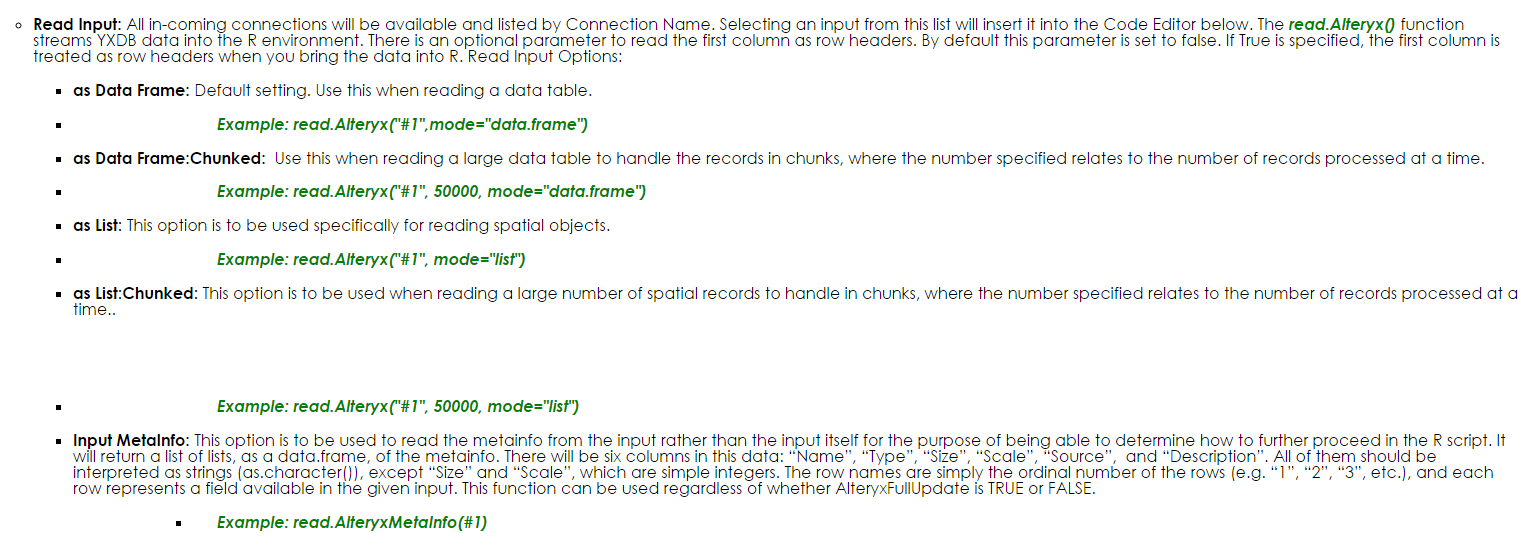
So a quick look at the alteryx R-tool help page (in reality I really should have started with this, but you live and learn) showed that we need to use the ‘insert code’ drop down to run an ‘alteryx specific command’ that will allow the R-tool to ‘read the input’.
A quick look at the commands available pointed me towards the ‘as data frame’ command (see below).
I inserted the code between the installation of the ggplot2 package and my script to create the scatter graphs (if you look at the configuration panel and are wondering what “#1” is, it refers to the connection name from my input, which if you look at the workflow you can see is #1). I got the same error again…
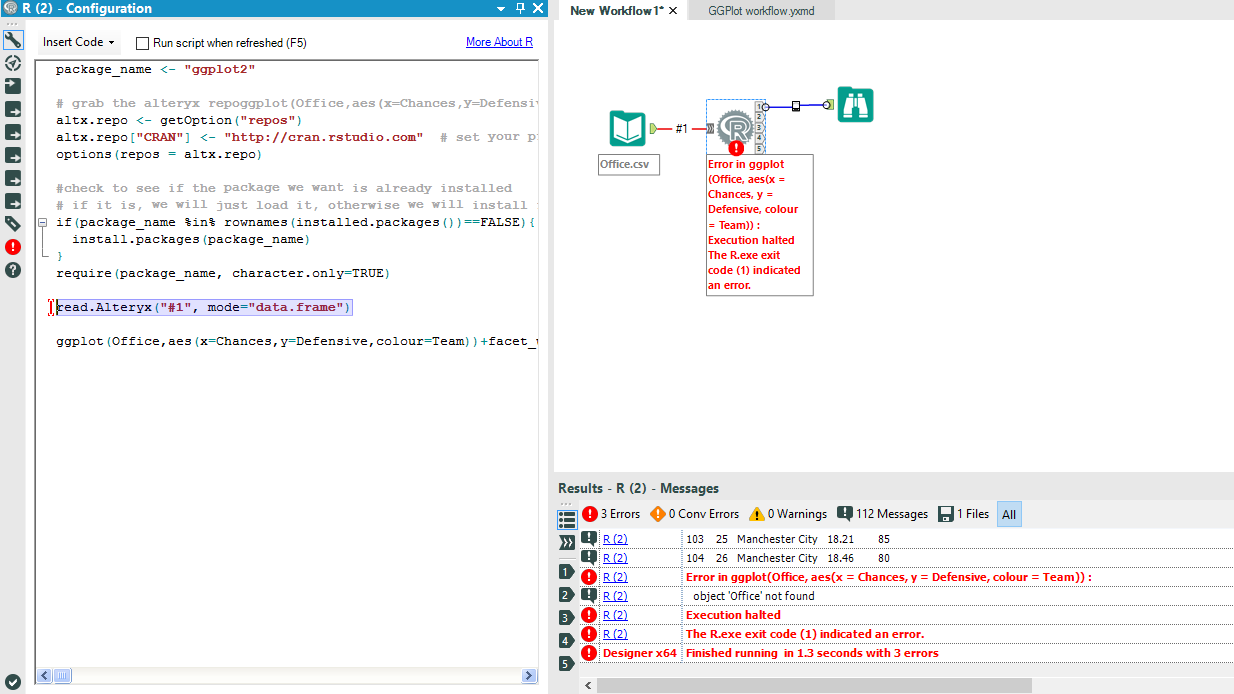
FML. Okay, back to the drawing board. Then, I suddenly had a brain wave, I replaced the word ‘Office’ at the beginning of my ggplot script with the command script I had just inserted above.
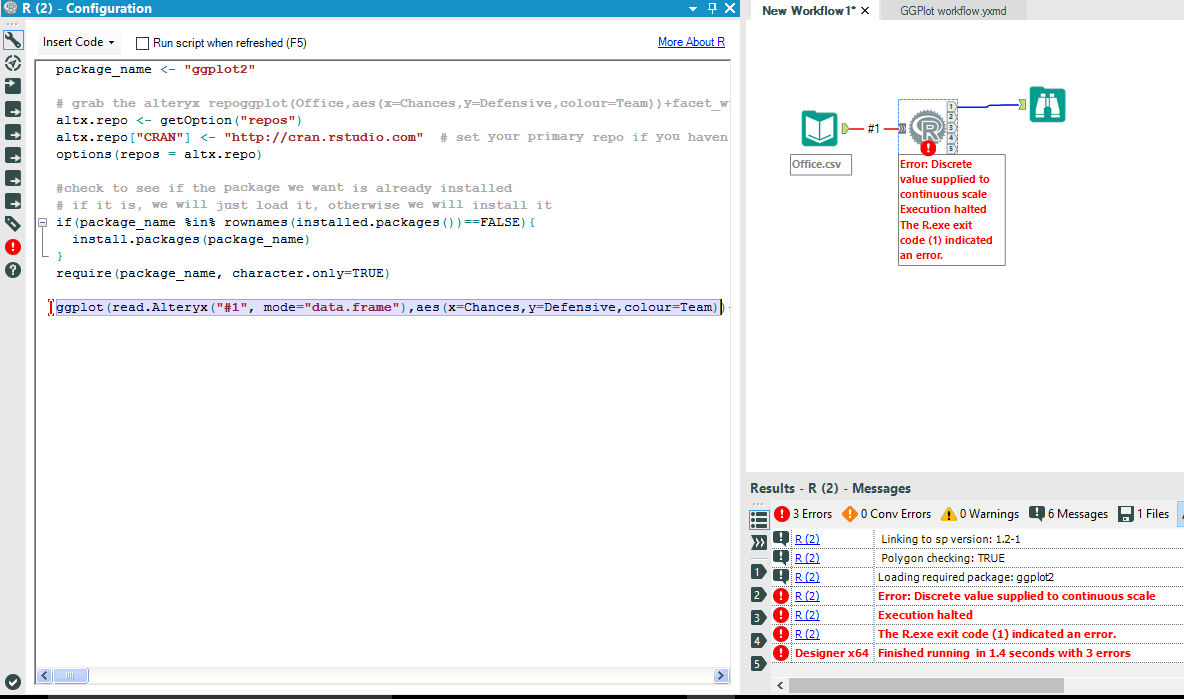
WOOOOOOO. A new error… we are getting somewhere. ‘Discrete value supplied to continuous scale’. Okay, I immediately knew what this one was about. The message suggested to me that my X and Y data which should be continuous values were being seen as discrete. I popped in a select tool between the input and my R-tool and I found that my X and Y data was being read as a string. I changed them both to Doubles…I ran the workflow again.
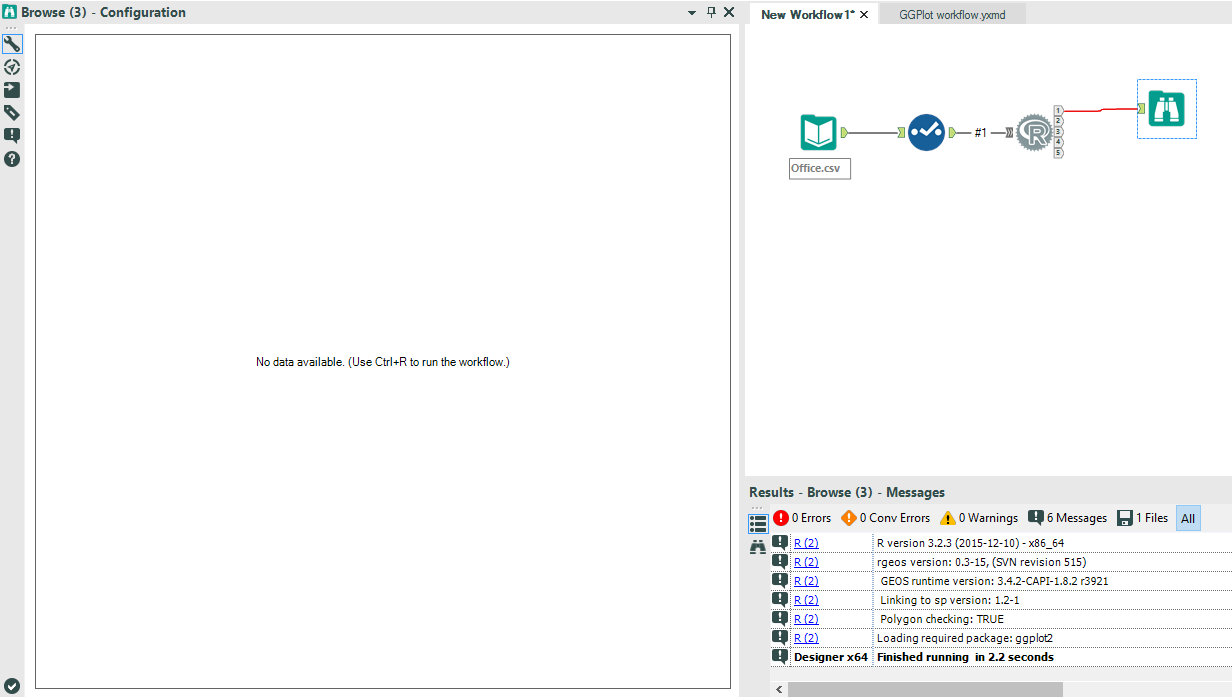
NO ERRORS….BUT NO ACTUAL OUTPUT. Back to the alteryx help guide for me, this time to look at how the outputs work. Ok, so you must actually insert another ‘alteryx specific command’ to generate your desired output which can be of many forms. The one that would seem best for me was the ‘create graphs’ command which I then assigned to my first output.
It inserted the command into my code panel automatically. Another bit of great design here from alteryx… it actually tells you what you need to do with the #insert code to plot graph here… so I did just that.
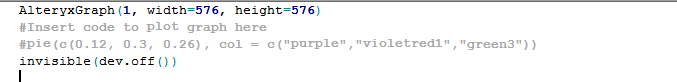
At the same time I also noted that I could alter the size of my graph output. I made this the same as the output I produced with RStudio. I ran my workflow and success!!!
I was pretty chuffed.
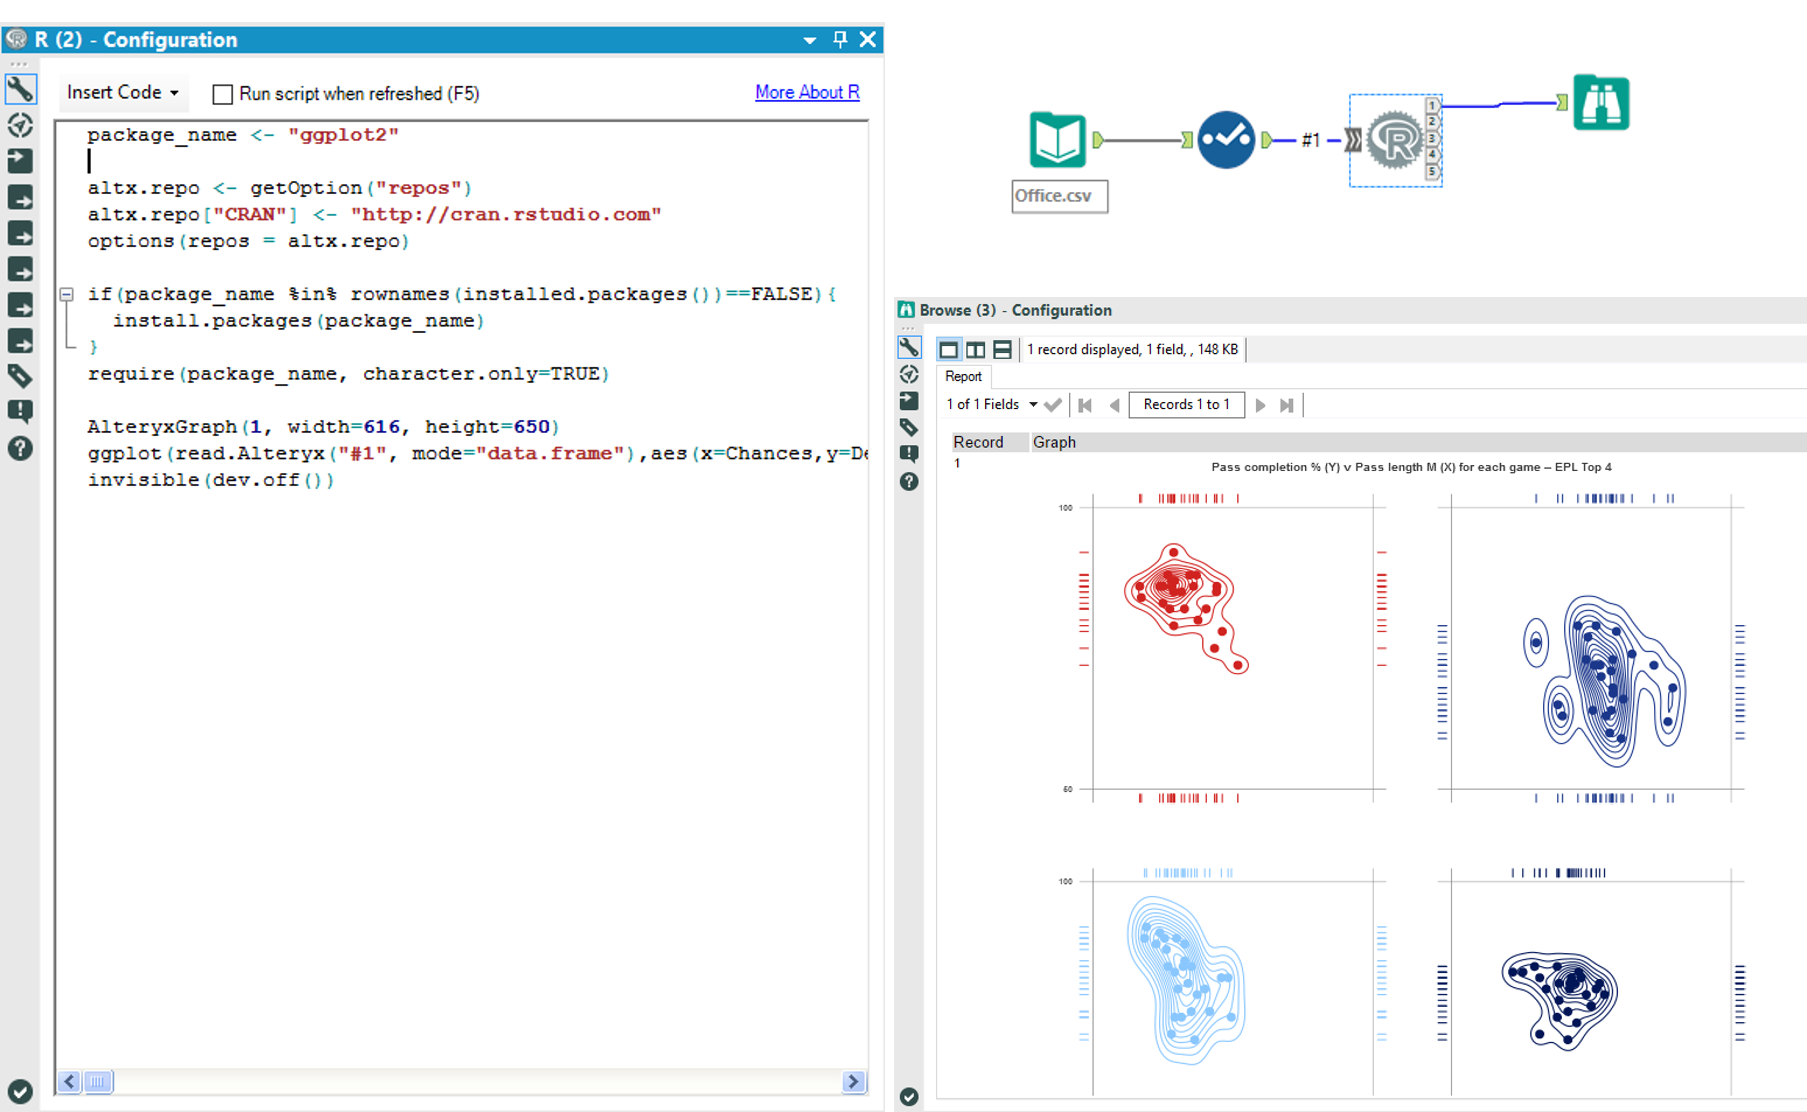
The below image shows the final configuration for the R-tool, the finished workflow and also the output.
I suppose that the main thing I learnt from this blog is how good the error messages are with alteryx, how easy they can help diagnose the problem, and also how good their help and community pages are as well.
If this blog helps just one person understand the R-tool in alteryx a bit better then I will be happy!
Hope you all enjoyed.
Ben