


Hello everybody!
Predictive analytics has always been a challenging concept for me.
During my financial degree and even before, during high school, I found this type of analysis to be tricky. Often you just know how to apply the model but you don’t really understand what underpins it.
For this reason, I decided to make this blog series explaining machine learning and predictive analytics in a simple way, hoping to help you apply this analysis with Alteryx tools in a more meaningful way.
First, I must give credit to https://www.coursera.org, which has a machine-learning course that I found gave really simple and clear explanations about predictive analytics.
Let’s start with regression aka SUPERVISED LEARNING.
In supervised learning, we have a data set and already know what our correct output should look like, having an idea that there is a relationship between the input and the output.
Supervised learning problems are categorized into “regression” and “classification” problems.
In a regression problem, we are trying to predict results within a continuous output, meaning that we are trying to map input variables to some continuous function. In a classification problem, we are instead trying to predict results in a discrete output. In other words, we are trying to map input variables into discrete categories.
For example: if we have data about the size of houses on the real estate market, can we predict their price? Price as a function of size is a continuous output, so this is a regression problem.
Linear regression with one variable
Univariate linear regression is used when you want to predict a single output value from a single input value. We’re doing supervised learning here, so that means we already have an idea what the input/output cause and effect should be.
Let’s do an example of this.
Let’s take the housing prices with different sizes (and different prices). A friend of mine wants to sell his house that is 1250 feet^2 and he wants to know the approximate value of it.
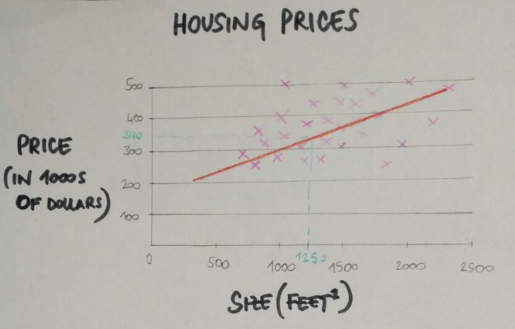
The idea is that you plot a line that best fits the data and based on that I can tell my friend that the house is worth 340k. This is an example of supervised learning and regression problem.
More formally, in supervised learning we have a data set called training set with the house prices and sizes. From this dataset I want to learn how to predict the house prices.
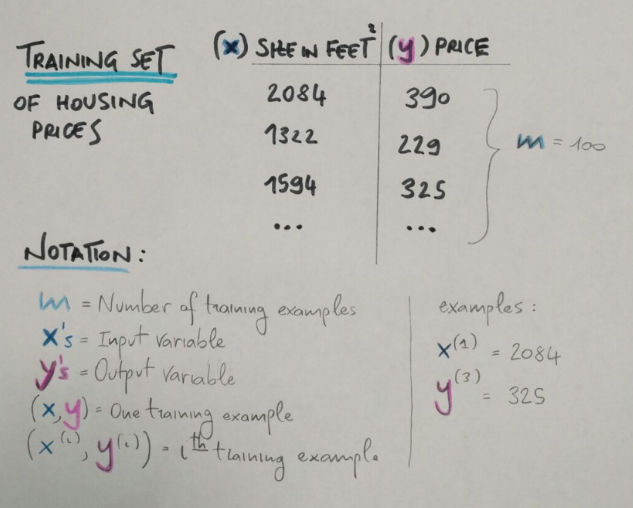
m = the number of training examples (number of rows)
x = input
y = output
(x,y) = one training example (one single row)
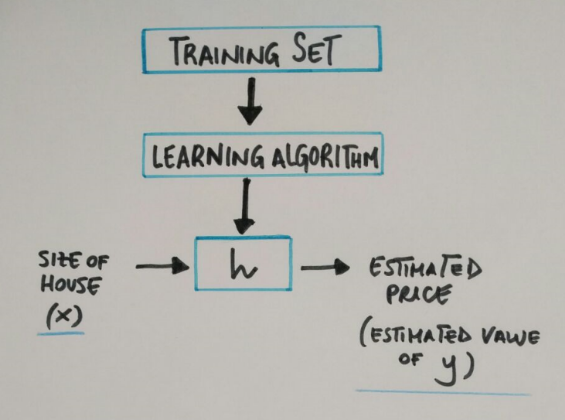
In general supervised learning needs:
a training set (house prices by sizes) which we fit to our learning algorithm. As an output we get h (hypothesis) which is a function that takes the size of houses as an input, and tries to output the estimate value of y.
h is a function that maps from x to y.
So how do we represent h?
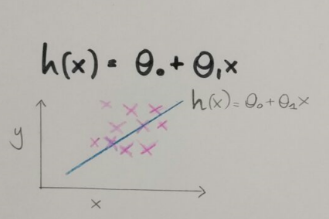
The function is predicting the value of y, given the value of x.
This model is called linear regression, better known as univariate linear regression because we have just one variable.
In my next blog post I am going to speak about the cost function which is actually what we use to decide which model best fits our data.
Hope it’s useful!
Thanks