


What’s the predictive analytics world?
When are they useful in the business content?
Which one of the Alteryx tools are appropriate to predict Sales/Profit?
In order to answer to all this questions, I will present three blog post:
Part 1 Clustering
Part 2 Predictive modelling methods
Part 3 Times Series (Simona)
Predictive analysis is a statistical analysis that is forecasting some variables like Sales, Profit, Customer Satisfaction through some indicators that we consider be predictors (demographic, investments…).
What do we do when we make predictions? We build statistical models that let analyse current and historical data (fields) to make predictions about future events, in order to find causal RELATIONSHIPS, INSIGHTS.
Here we concentrate in grouping methods like clustering.
Why do we do cluster in general? We want to find similarities to optimize efforts, focus efforts, investments, etc.
In cluster analysis we want to minimize the sum of distances WITHIN a cluster while maximize the distances ACROSS clusters.
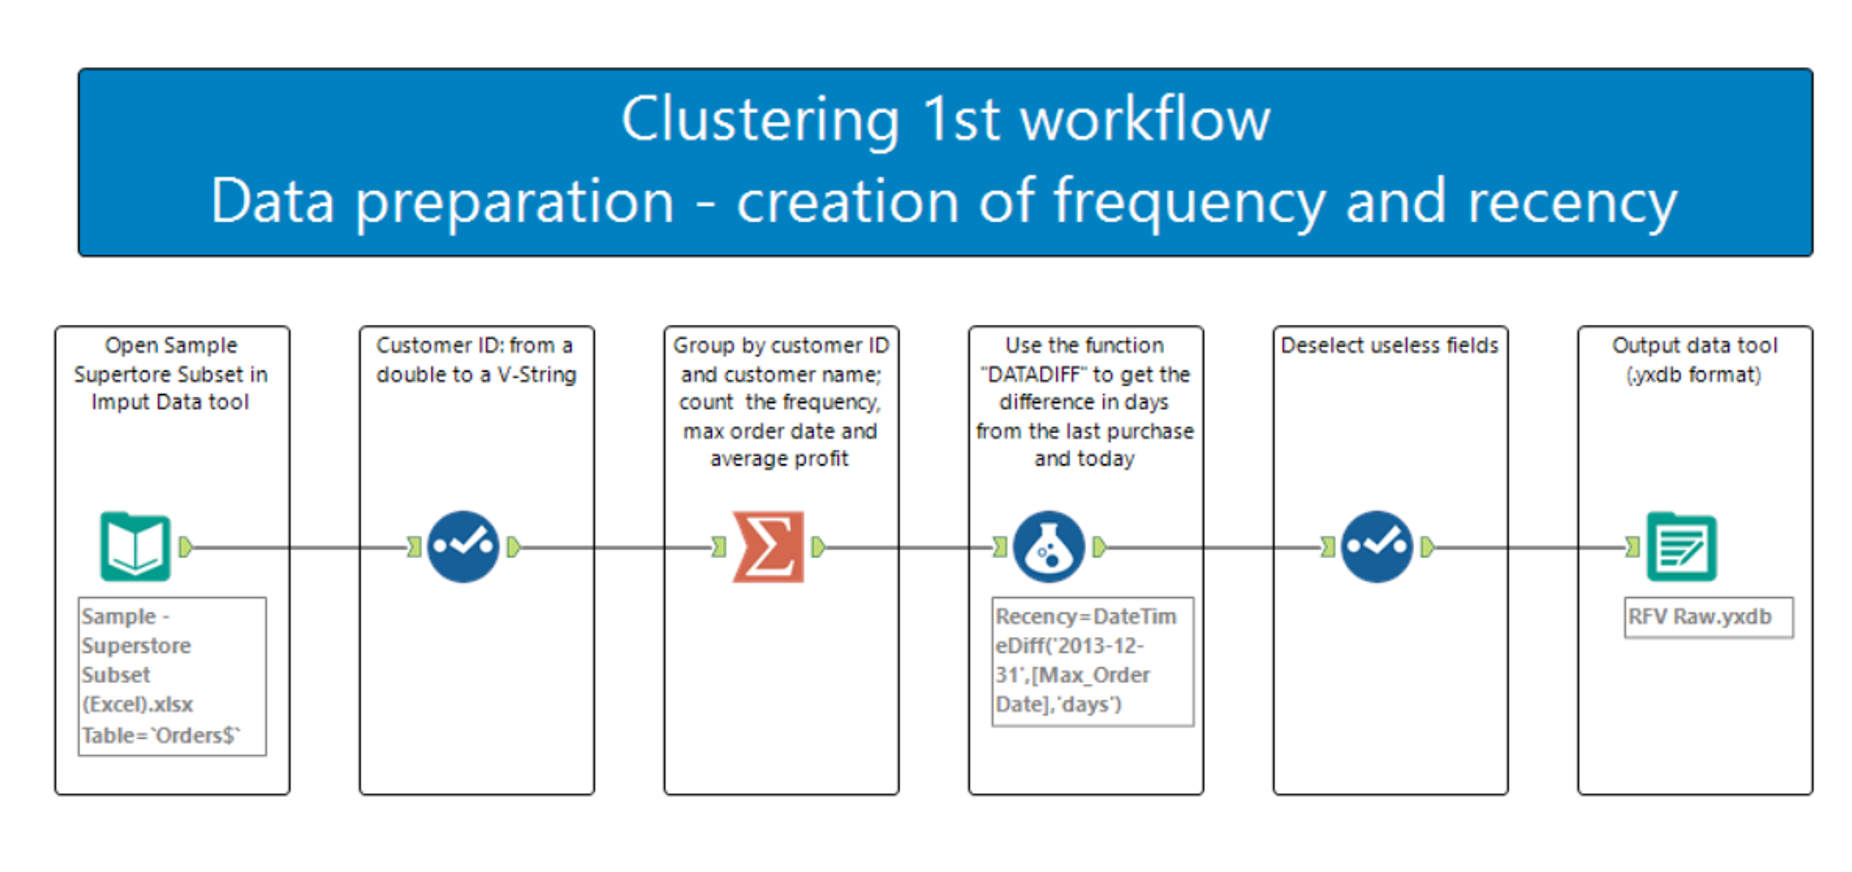
Let’s open superstore subset (orders) with an input data tool, put the select tool and change customer ID from double to V_String. Then with summarize we group by customer ID and customer name, then we count customer name and we call it ‘frequency’, we take the max of order date and the average of profit (call it value).
With formula tool you can use a function called DateTimeDiff(dt1,dt2,u) that calculate the days (‘u’ as unit) from the last (max) order date and today (or what date we prefer). We deselect the fields we don’t need and then we create an output data tool.
We open a new workflow and we use as an input the last created output. Drag the K-Centroid Cluster Analysis tool from predictive grouping and make sure you do the following steps: tick the fields of your interest, standardize the fields, choose your clustering method (k-mean, k-median or neural gas), and choose the number of clusters you think is appropriate.
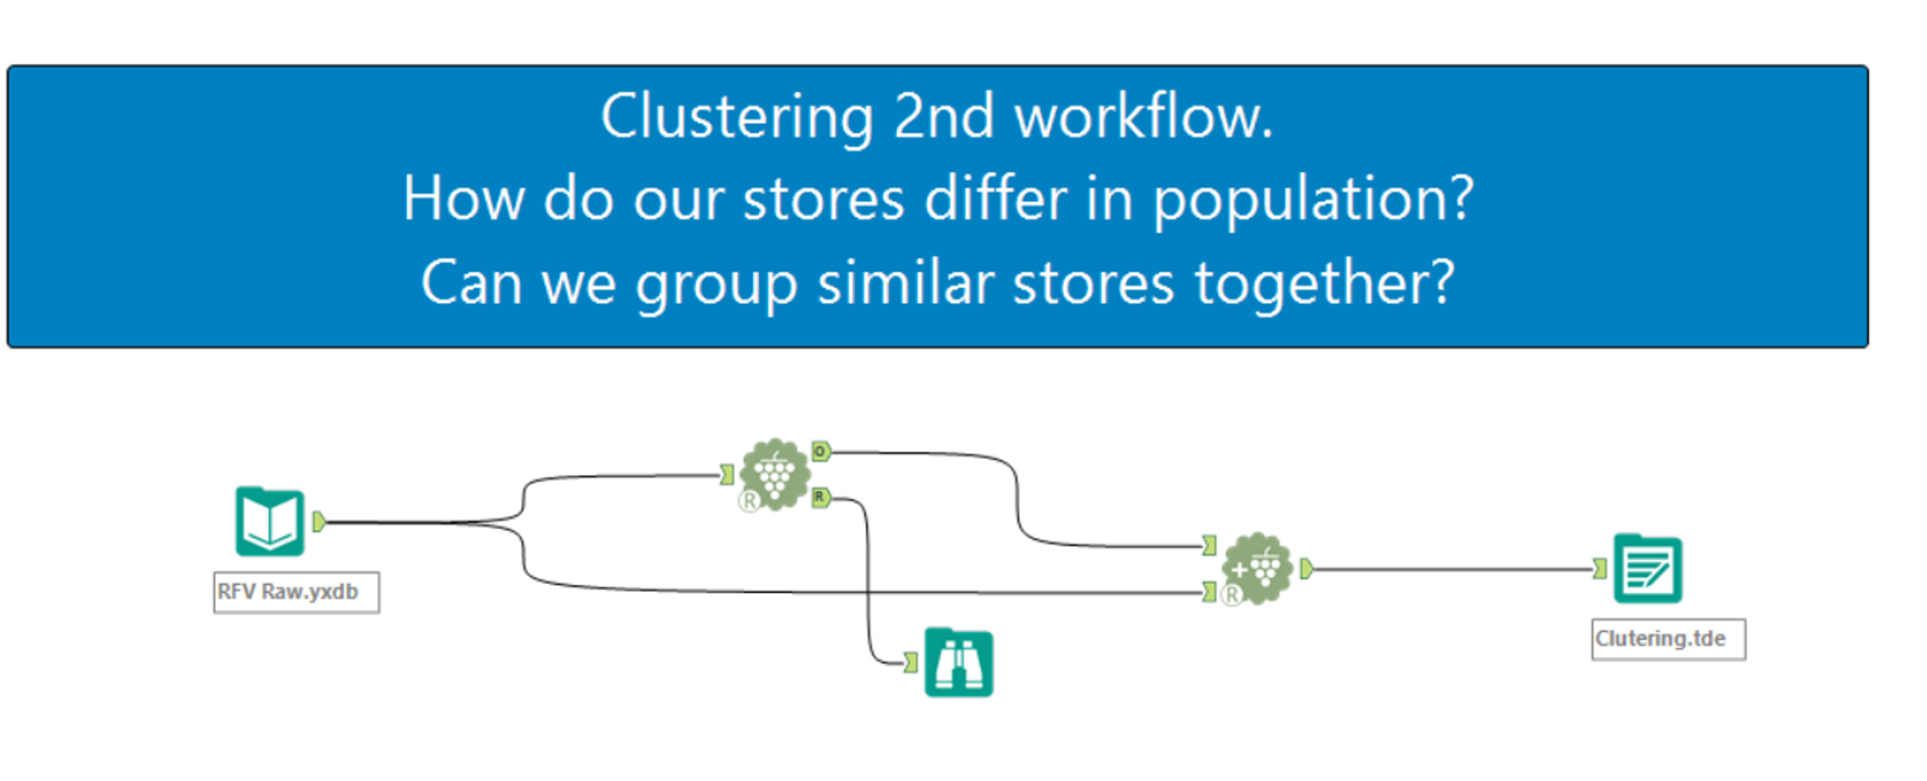
You will get two output nodes: R is the report and O the R code output. Drag the append cluster tool to link the cluster membership back to the original records. Create a output data tool as a .TDE file for Tableau.
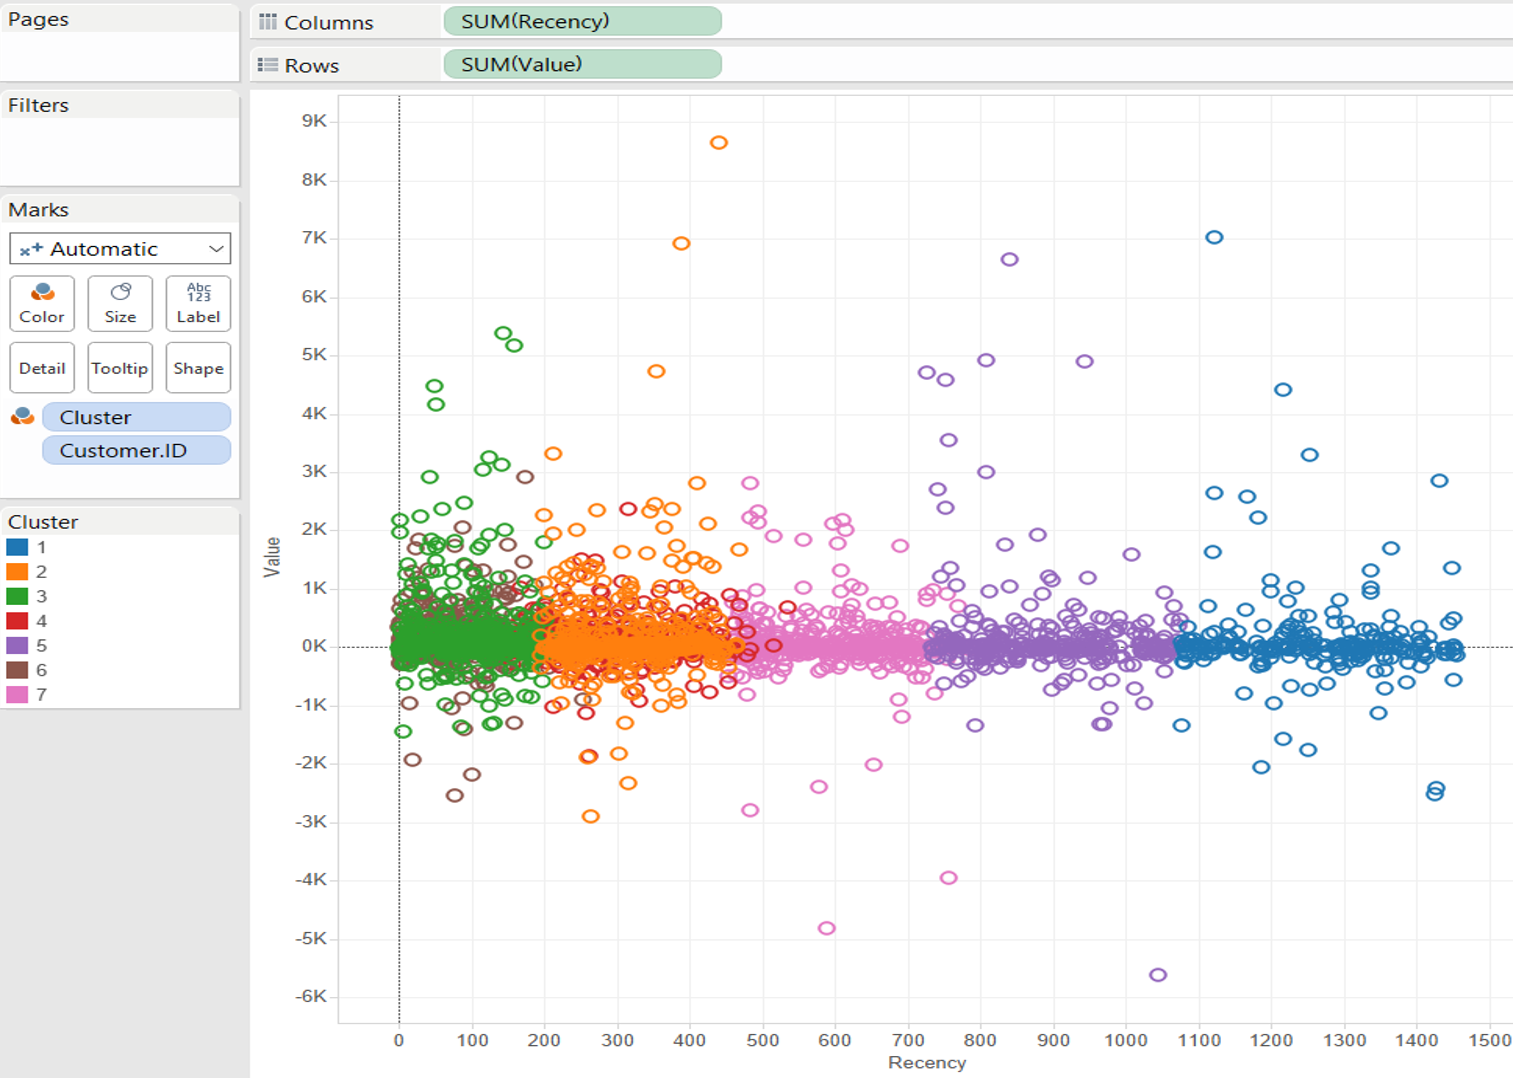
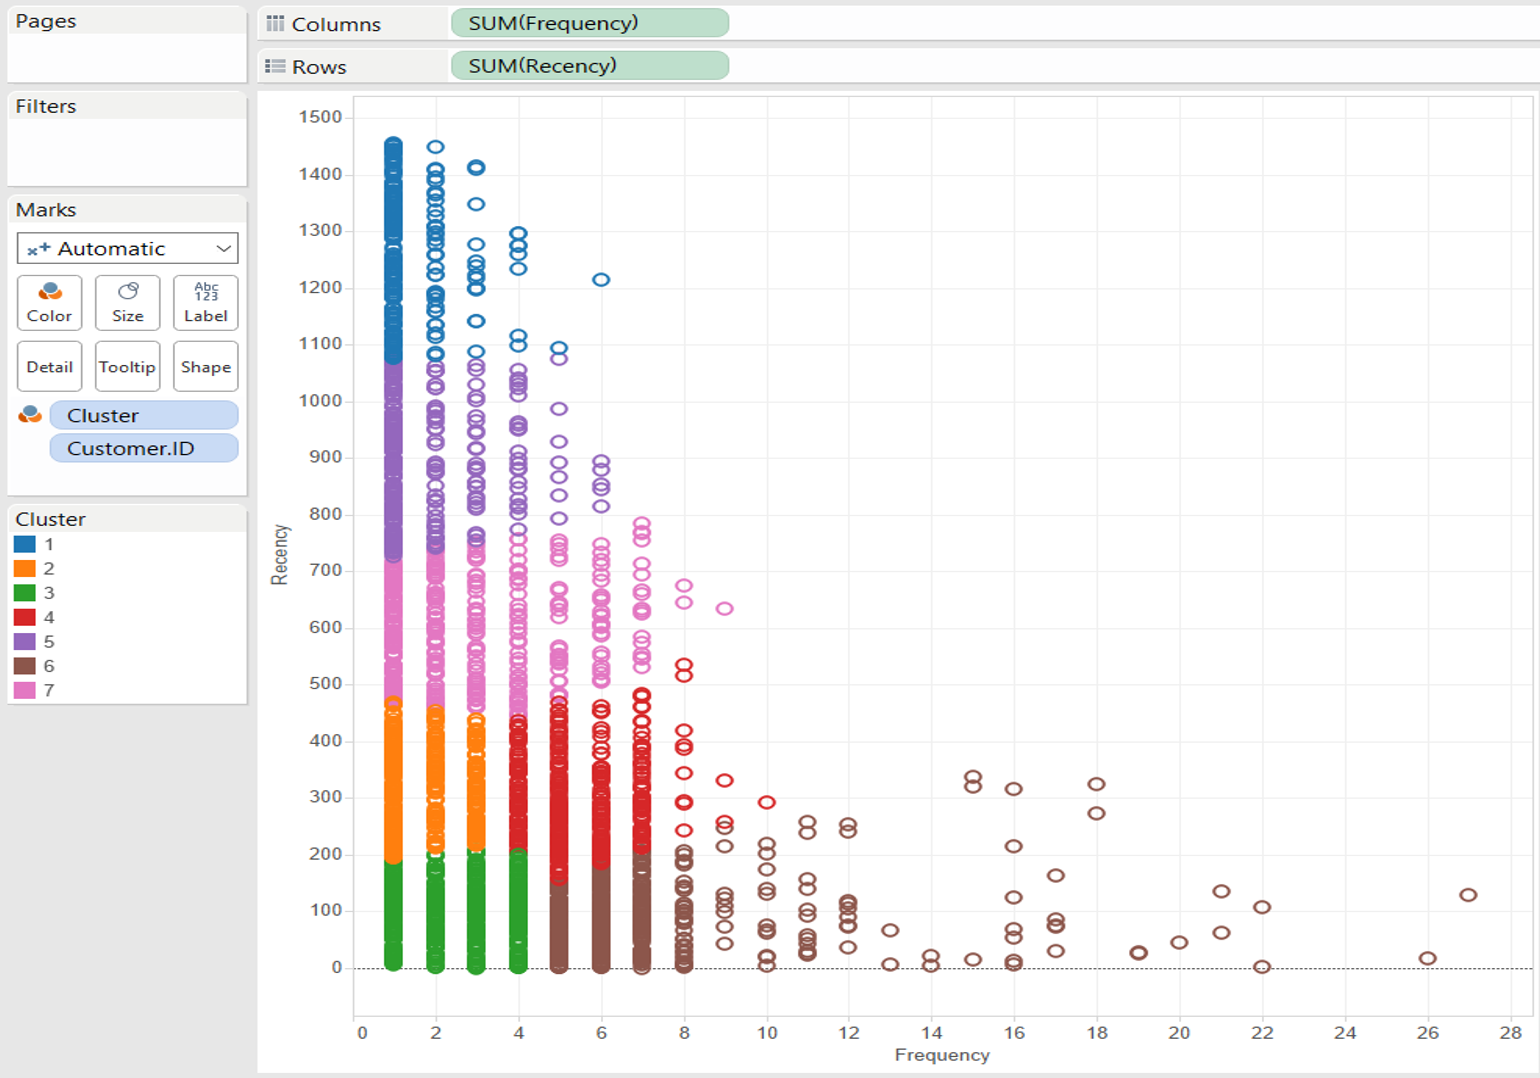
Drag recency in columns and value (profit) in rows. Drag cluster in colour and break it down by Customer ID (detail). You can also compare frequency (columns) against recency (rows).
Hope you field this blog post useful!
Please write me if you need more details. Enjoy clustering!
At the last Tableau User group I heard that on the next Tableau version it would be possible to create clustering directly in Tableau! It would be interesting to run it both in Tableau and Alteryx and see the outcome.