Hi everyone! This article is intended to give you some quick tableau tips that improve performance, efficiency of work and perfect your formatting! All of the tips are included in this workbook that is available to download so you can test the tips out yourself. These tips are split into two parts (technical and formatting) so be sure to check out both blog posts!
https://public.tableau.com/app/profile/bethan.donovan/viz/SpeedTips/Welcome
Formatting Tips:
1) Make a quick info button
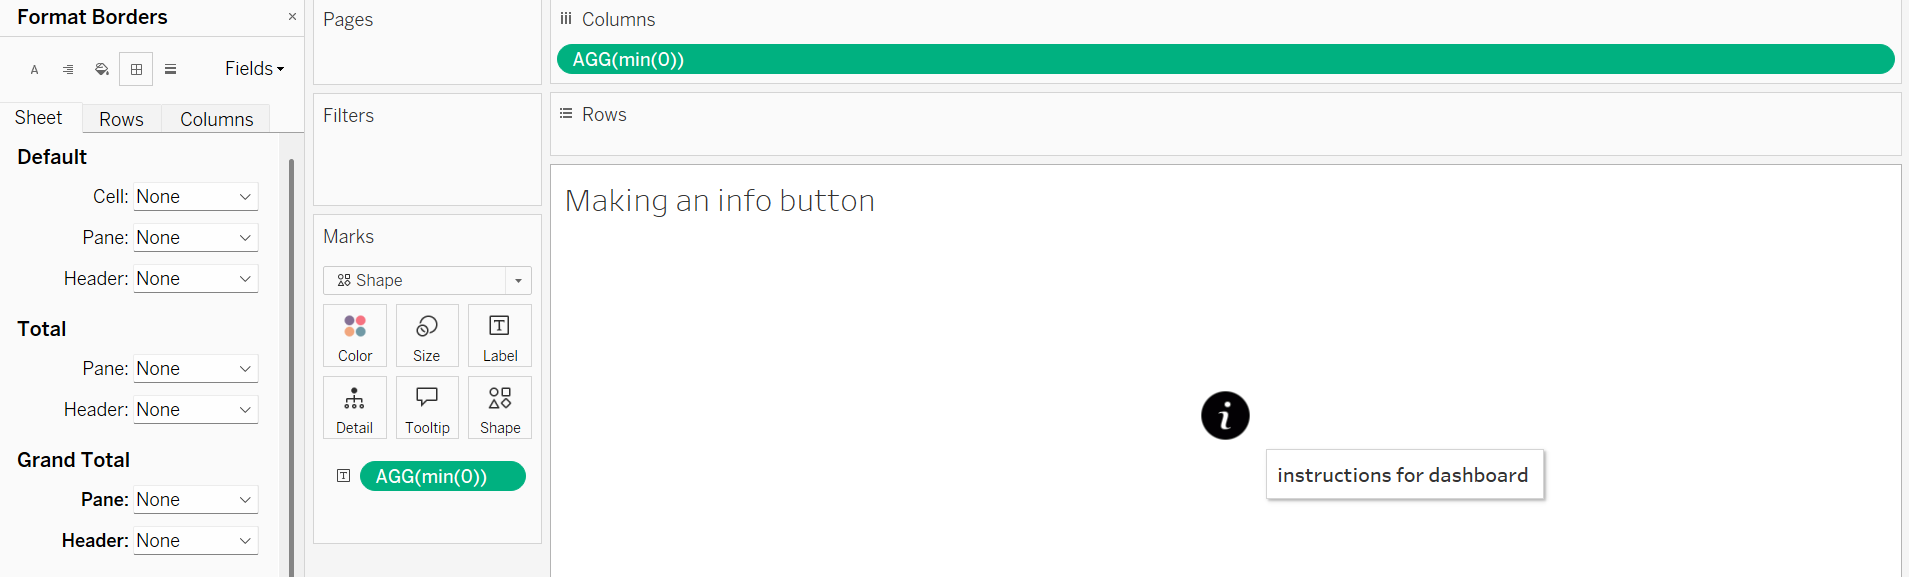
Info buttons are extremely useful, they allow you to add detailed directions for your end user, without cl0gging up your dashboard with tonnes of text.
- Double click in the 'Columns' box, and type 'min(0)'
- In the 'Marks' card, change the chart type from 'Automatic' to 'Shape'
- Set the view from 'Standard' to 'Entire View'
- Change the shape to an info icon (requires custom shape), or to a circle.
- If choosing a plain circle, hold ctrl and drag the 'min(0)' from columns, and add it to label, then edit the label to either be a ? or i, and align it to centre so it sits inside the circle.
- Adjust the size of your point using the marks card, and alter font size of the label to make a nice looking info icon.
- Remove all lines/background, by right clicking anywhere on the canvas, selecting format, and switching fill to nothing, and setting lines and borders to none. Right click on the header (min(0)) and hide header.
- Final step: fill in the desired information in the tooltip on the marks card, and voila!
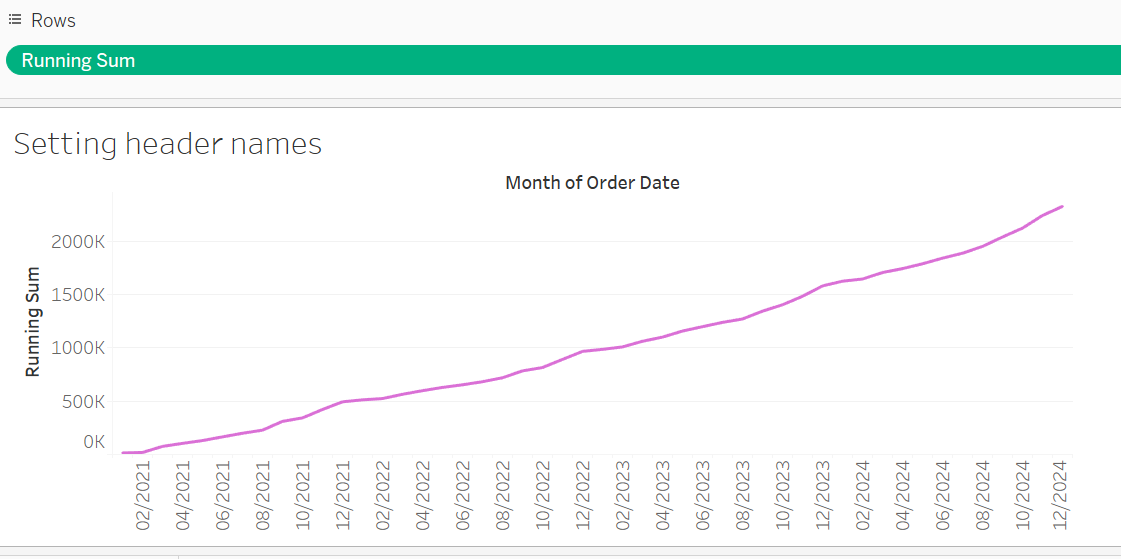
2) Quickly change field names
Sometimes, when creating charts, especially with table calculations, we can get some very strange header names. For example, here I have applied a running sum table calculation on my sum([sales]), this has resulted in the following header (shown to the left).
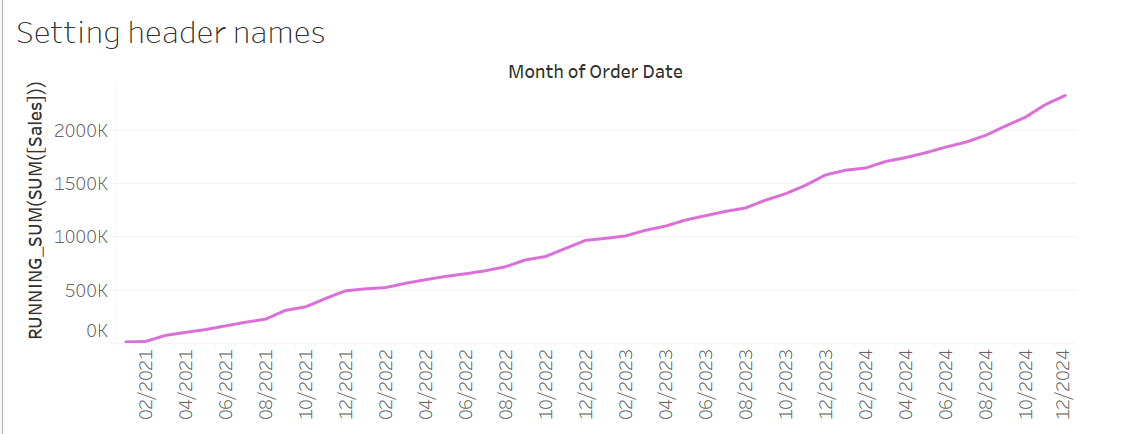
It is actually possible to quickly rename fields in order to get a neater header, without altering the field itself in any way.
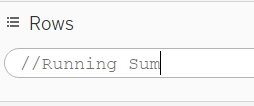
First double click on the field you want to alter the header of. Then type:
//[NEW NAME]
(in this example I am renaming to 'Running Sum', so I would type //Running Sum)
Then press (Shift+Enter), then (Enter)
Voila!
3) Pinch custom shapes
This is by far my favourite tip of all, albeit ethically questionable. Sometimes I peruse tableau public for fun (if you can believe it). I often come across super cute, unique and fun custom shapes, and I think to myself 'Where the hell have they gotten those from!!'. Luckily there is an amazing tip just for this predicament.
First find a dashboard with shapes you want to steal, and download a copy of the workbook (I'll call this the source workbook). Open up your source workbook, and open up the target workbook . Simply right click on any of the sheet tabs in the source workbook, and copy it. Then open your target workbook, and right click in the blank space to the right of your sheet tabs, and paste. The custom shapes from the source workbook should now be available in your target workbook!
4) Automatic dashboard resizing
Typically within an organisation, staff will all have identical monitors/laptops, meaning dimensions are universal across the business. This means you will want to select a dashboard size that suits your companies dimensions. Rather than googling/guessing dimensions, you can get tableau to do it for you!
First create a new dashboard. Then when selecting the dimensions, change the type from 'Fixed' to 'Automatic'. Setting type to 'Automatic' allows tableau to capture the dimensions of your screen, however, it also means the dashboard dimensions change depending on which screen you view it from. So the last step is to set it back to 'Fixed'. This will then maintain the screen size recognised when set to automatic.
Tableau Server/Cloud exclusive tips:
The following tips are only applicable to workbooks that have been published to Tableau cloud/server/public
5) Font resizing
99% of the time, when publishing a workbook to cloud/server/public, the font size you have selected when formatting in Tableau Desktop looks completely different once published. Instead of guessing font sizes in desktop and hoping for the best, you can easily reopen the workbook in web edit, after publishing, and adjust the font sizes here. When republishing the font size should now look exactly right!
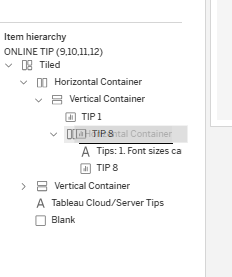
6) Drag and drop dashboard items
This tip harkens back to a question I asked in training. As we know, when building a dashboard, on the left hand side, in the 'layout' tab, at the bottom there is an item hierarchy that details how objects are within containers. In training I asked if it was possible to drag and drop items in the item hierarchy. It is not possible in Tableau desktop, however it is possible in server/cloud/public. Simply open the item hierarchy, and drag items around to the location you want. This is useful when locations are particularly tricky to access by dragging directly onto the dashboard.
7) Press g for gridlines
When working on a dashboard in web edit, if you press 'g', gridlines will show up, allowing you to get pixel perfect formatting!
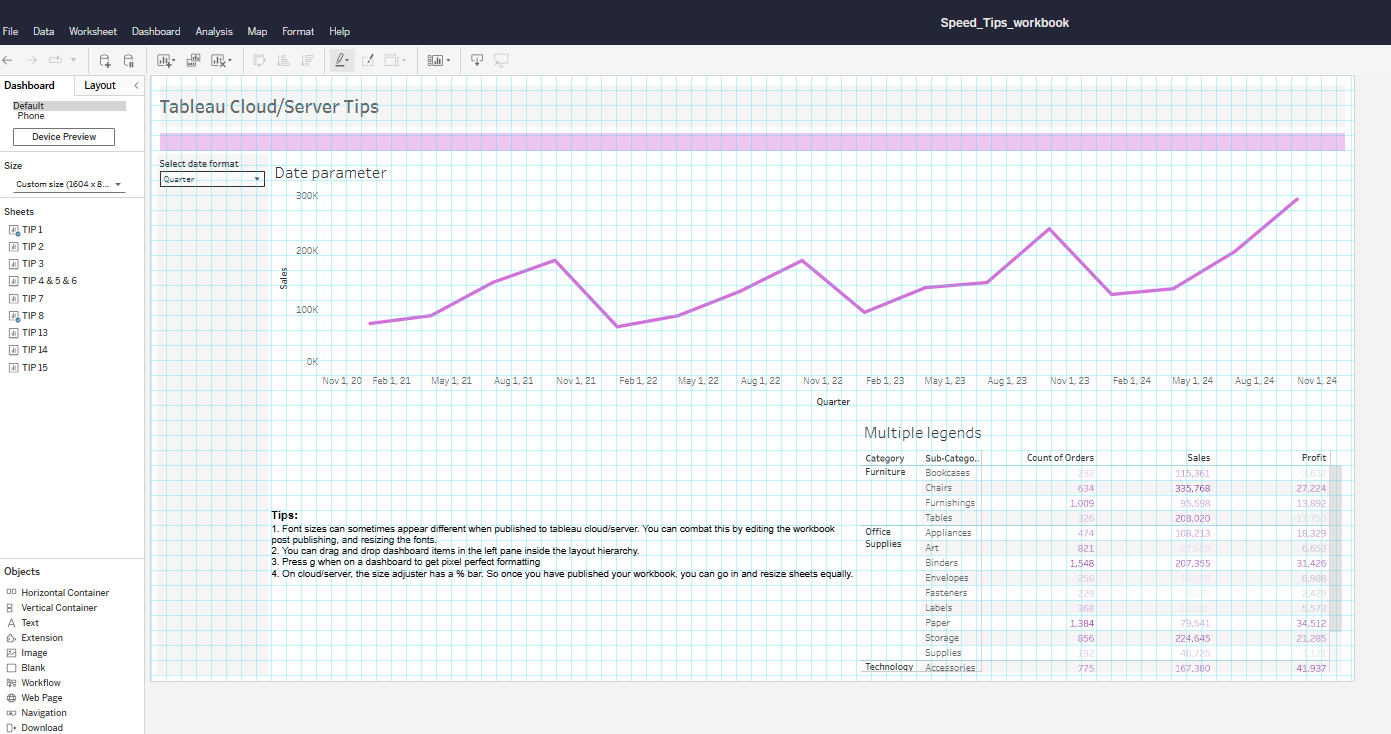
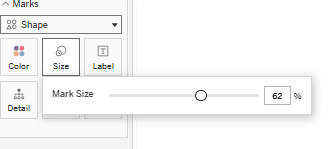
8) Adjust size setting as a %
When in tableau desktop, adjusting the size on the marks card is only possible via a slider with no labels. If I want the size setting to be uniform across multiple sheets, it can be really difficult to get the slider at the exact same spot to create uniformity. Tableau cloud/server/public luckily includes a % box next to the slider. Simply upload your workbook to whichever platform you use, and edit the size using the % box to get uniform sizing across sheets!