Hi everyone! This article is intended to give you some quick tableau tips that improve performance, efficiency of work and perfect your formatting! All of the tips are included in this workbook that is available to download so you can test the tips out yourself. These tips are split into two parts (technical and formatting) so be sure to check out both blog posts!
https://public.tableau.com/app/profile/bethan.donovan/viz/SpeedTips/Welcome
1) Using lowercase in a date level parameter
In this example, we have a date level parameter that allows a user to switch the level at which they want to view the date (day, week, month, quarter).
Typically, you would create this calculation to allow the parameter to work:
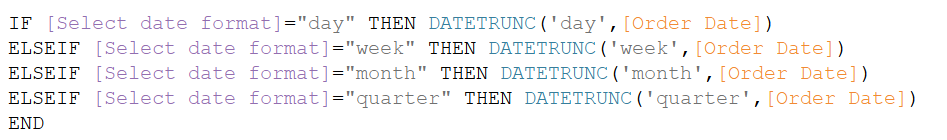
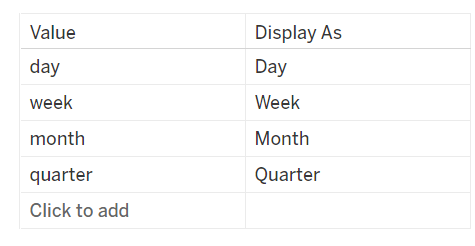
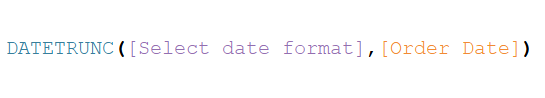
Instead, if we input the parameter values in lower case, and alias them in uppercase (clean formatting), we can use the parameter directly inside the DATETRUNC function, eliminating multiple lines of code.
Meaning this will be our final calculation:
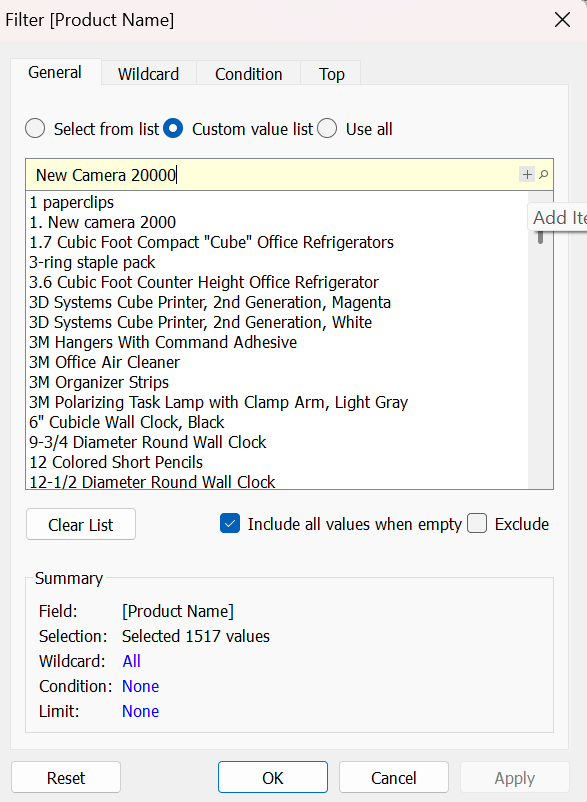
2) Custom value in a filter
In this example, we have a chart filtered to a specific line of products produced by a company. They have a filter on product name, selecting only the products from that line. They have a new product that is not yet in the dataset, but still want to add it to the filter condition. In this case you can simply use the custom value list option. Type in the value you want to add (ensuring it will match perfectly with the format of new data), and when the new values enter the workbook via refresh they will be included in the filter condition.
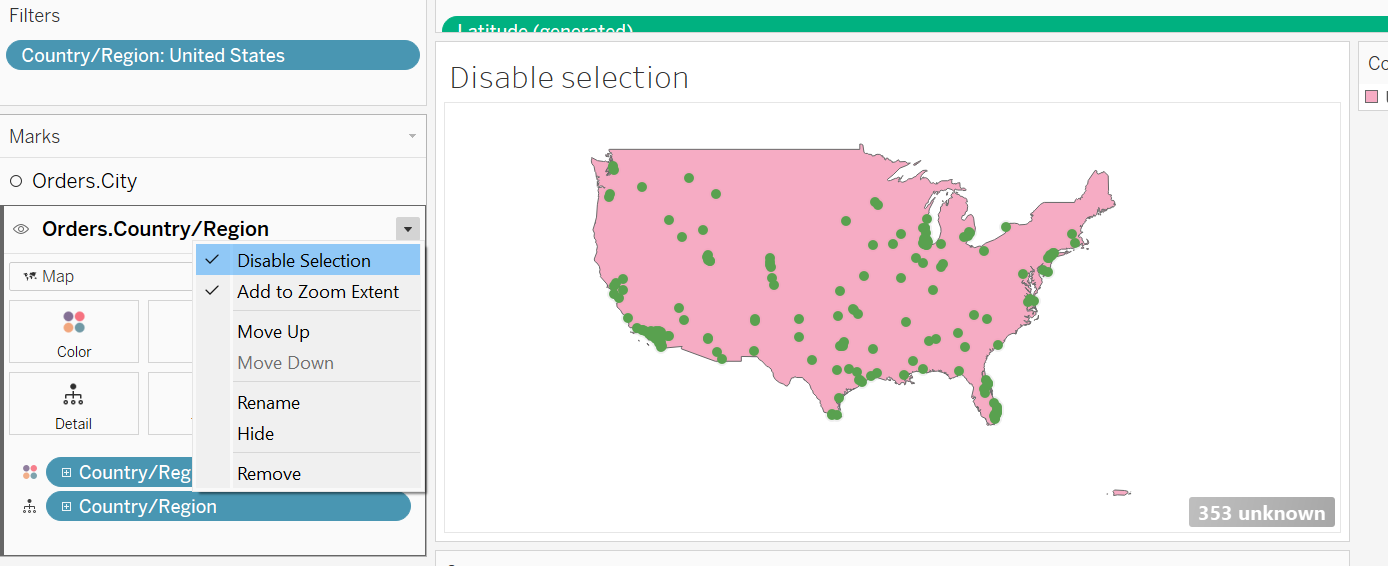
3) Disabling map selection
In this example we have a map with multiple layers, the base layer is the overall map, and on top are points for different cities. Both layers are interactive, meaning you can hover over both the under map layer, and the points on top, however this can make it difficult to hover over certain points, especially at the edges of each country. We can quickly eliminate this issue by disabling the map selection on the under layer, since no information is necessary from this layer.
Simply navigate to the correct marks card, and at the side of the marks card title is a small drop down arrow, inside this is a 'Disable map selection' option, select that and job done!
4) Working behind calculated field window
Unlike any of the other pop up windows in Tableau (such as parameters), is it actually possible to work behind the calculated field window, and drag items from inside to outside the calculated field, and vice versa. This tip can be extremely useful when testing tricky calculations, as you can type out your calculation, highlight it and drag it outside of the window onto rows/columns, or wherever you need it to be, and check it is computing correctly before you save the calculation. This saves time, rather than creating the calc then noticing it is wrong, and reopening it, you can do all your testing while the window is still open!
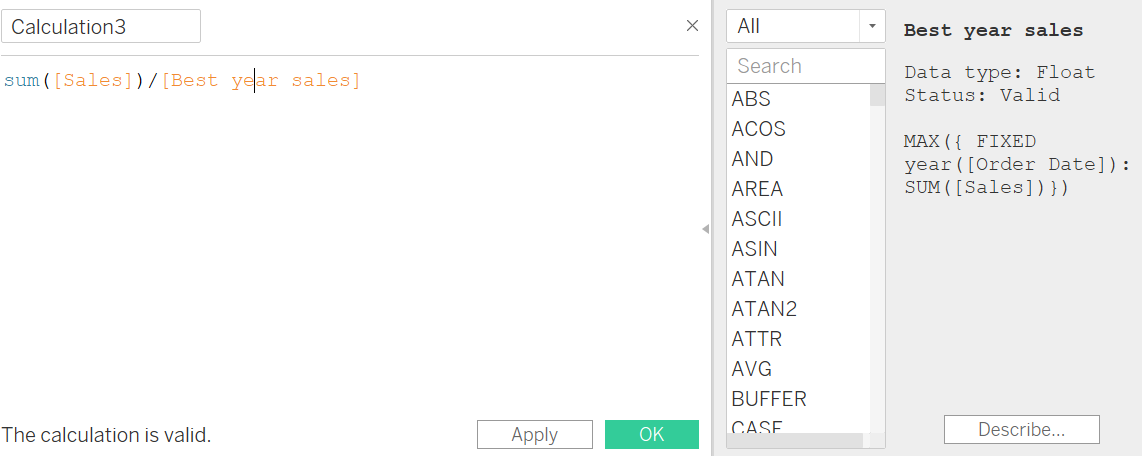
5) Peekaboo calculations
This tip would have saved me a TONNE of time during my placement, so I will impart this knowledge now.
It is possible to view a nested calculation without closing, and opening the other calculation. In this example I have a previous calculated field called 'Best year sales', which I am then using in a secondary calculation. If I click on 'Best year sales' with the right hand 'hint' window open, it will show me how 'Best year sales' is being calculated!
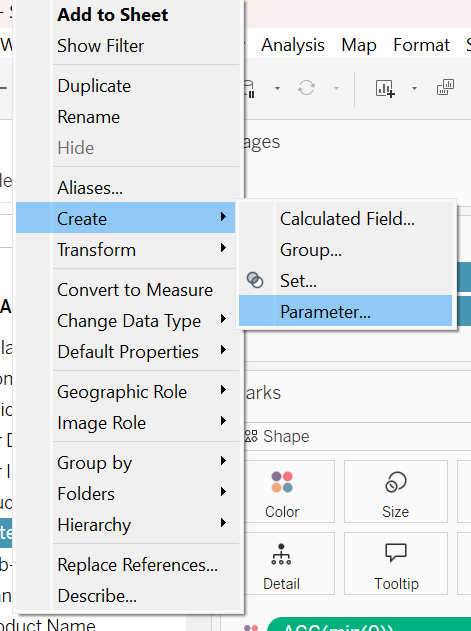
6) Instant create parameter
As we know, when creating a parameter, you can select 'Add values from', to take your parameter values from a specific field, however there is a quicker way to create a parameter from a field. Simply right click on the desired field in the data pane, hover over 'Create' and then choose 'Parameter'. This opens a 'create parameter' window, with the values being taken from the chosen field.
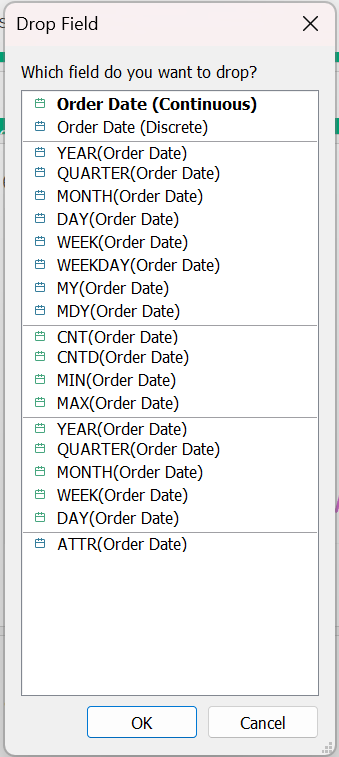
7) Right click to drag date fields
By default, when dragging a field on that is a date, tableau will default to Year([date field]). You would then have to enter the drop down of the field and select the date format you need, (unless you originally wanted year !). This obviously adds to processing time, as it first processes the YEAR type, and then reprocesses when you change the type. Instead if you right click and drag the field onto your sheet, a window will pop up that allows you to choose the date format before any processing occurs!
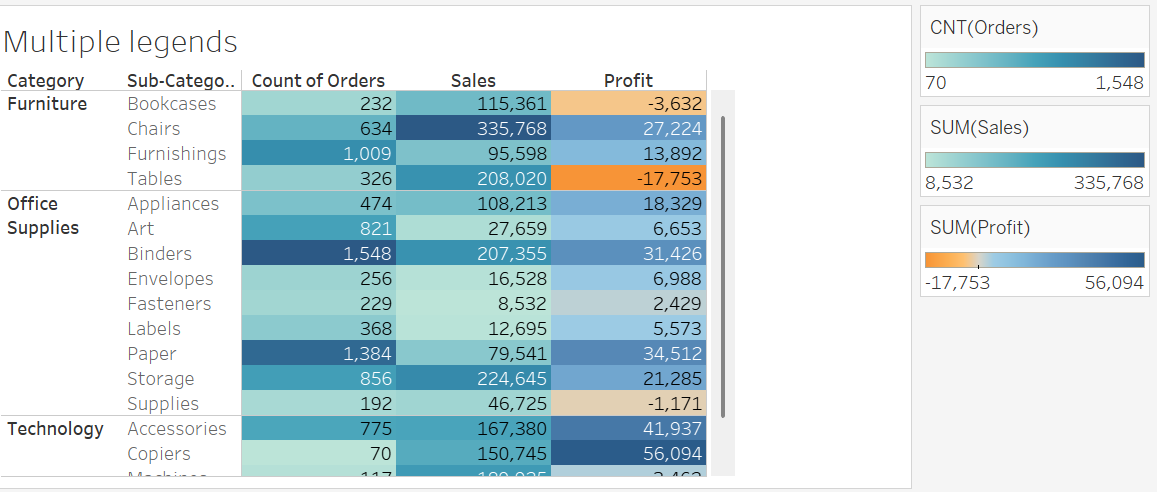
8) Multiple legends
In this example we have a table, showing the orders, sales and profit for different sub-categories. We want to colour the cells based on their value, however when I put my measure values onto colour, the legend is skewed. Sales numbers are much higher in comparison to orders (shown below).
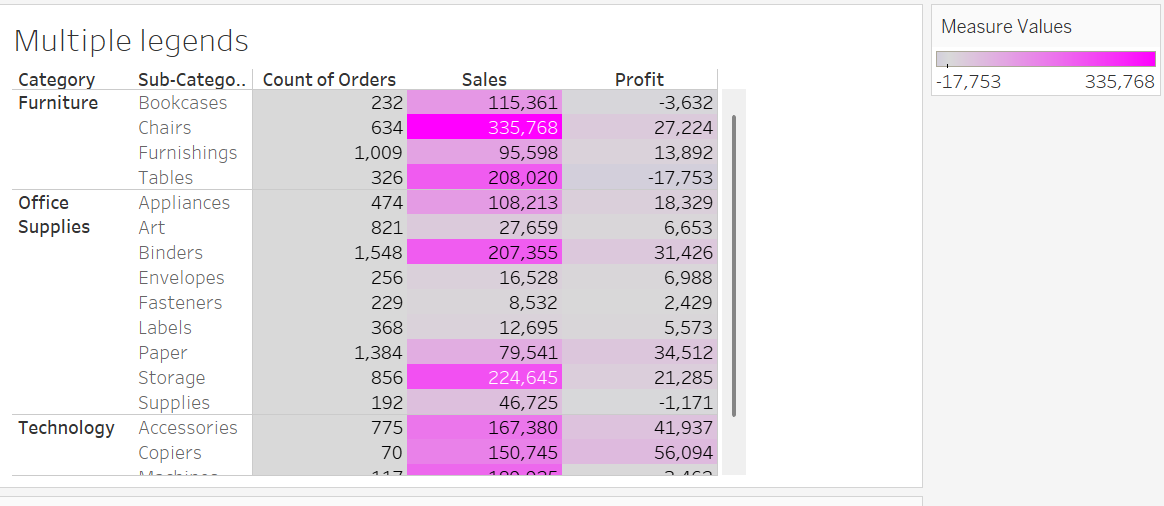
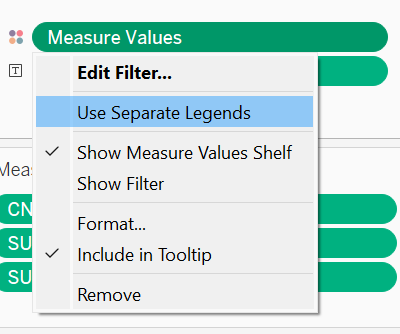
We can actually separate these legends, which gives them separate ranges, making the colouring more sensical. You can do this by selecting the small arrow on the right of whichever field has been applied to colour, and choosing 'Use separate legends'.