


In my previous blog…
I explained how to use parameters to change the view in a dashboard. When creating the final view, I deleted each colour legend from the dashboard, as when their corresponding sheets were not selected in the parameter, the colour legends would show NULL, which is not great to see. Here I will show you how to get around this.
N.B. This tip only works if the measure on colour is the same for each worksheet in the dashboard.
How to create a worksheet for a dynamic colour legend
Firstly, we create a new calculated field which will change depending on what’s selected in the parameter. To do this, we make use of a CASE statement which will specify what dimensions are related to which view.
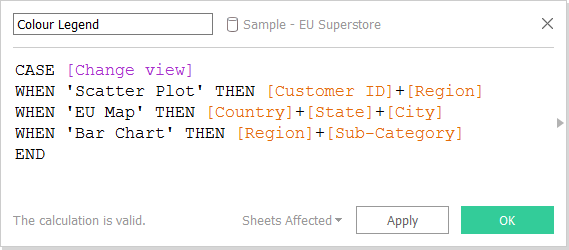
The reason we use ‘+’ to combine the dimensions in each field is because they are all strings. Also, if any of your dimensions are in a hierarchy, like ‘City’ is here, make sure you include all the dimensions that are a higher level of aggregation, to make sure you get each individual entry (this is important if there happens to be two cities with the same name appearing in two different countries).
After creating the calculated field, drag it on to the rows, and then drag the measure you want for your colour legend on to colour in the marks card, in this case ‘Profit’. Now your colour legend will change in this worksheet for each selection of the parameter.
Finally, drag this worksheet on to the dashboard which contains all the other views (scatter plot, bar chart, etc.). Hide the title of the sheet, and manually edit the height to be 1 pixel high, which will effectively hide the sheet completely. Now you’ve got each of the views you wanted, with a colour legend which changes depending on the selection of the parameter! Check out the steps in action in the video below…
[youtube https://www.youtube.com/watch?v=7dFKNV1o4hM&w=560&h=315]
Now, this all works great if you’ve got the same measure for the colour legend on each worksheet. But what if you want to show different colour legends?…
For my next Tableau Tip…
I will be looking at developing my dynamic dashboard further by incorporating different types of colour legend.