I have been reworking a dashboard that I first created before I started at The Data School. It was my first ever use of Tableau and looked at house building in the UK between 1949 and 2025.
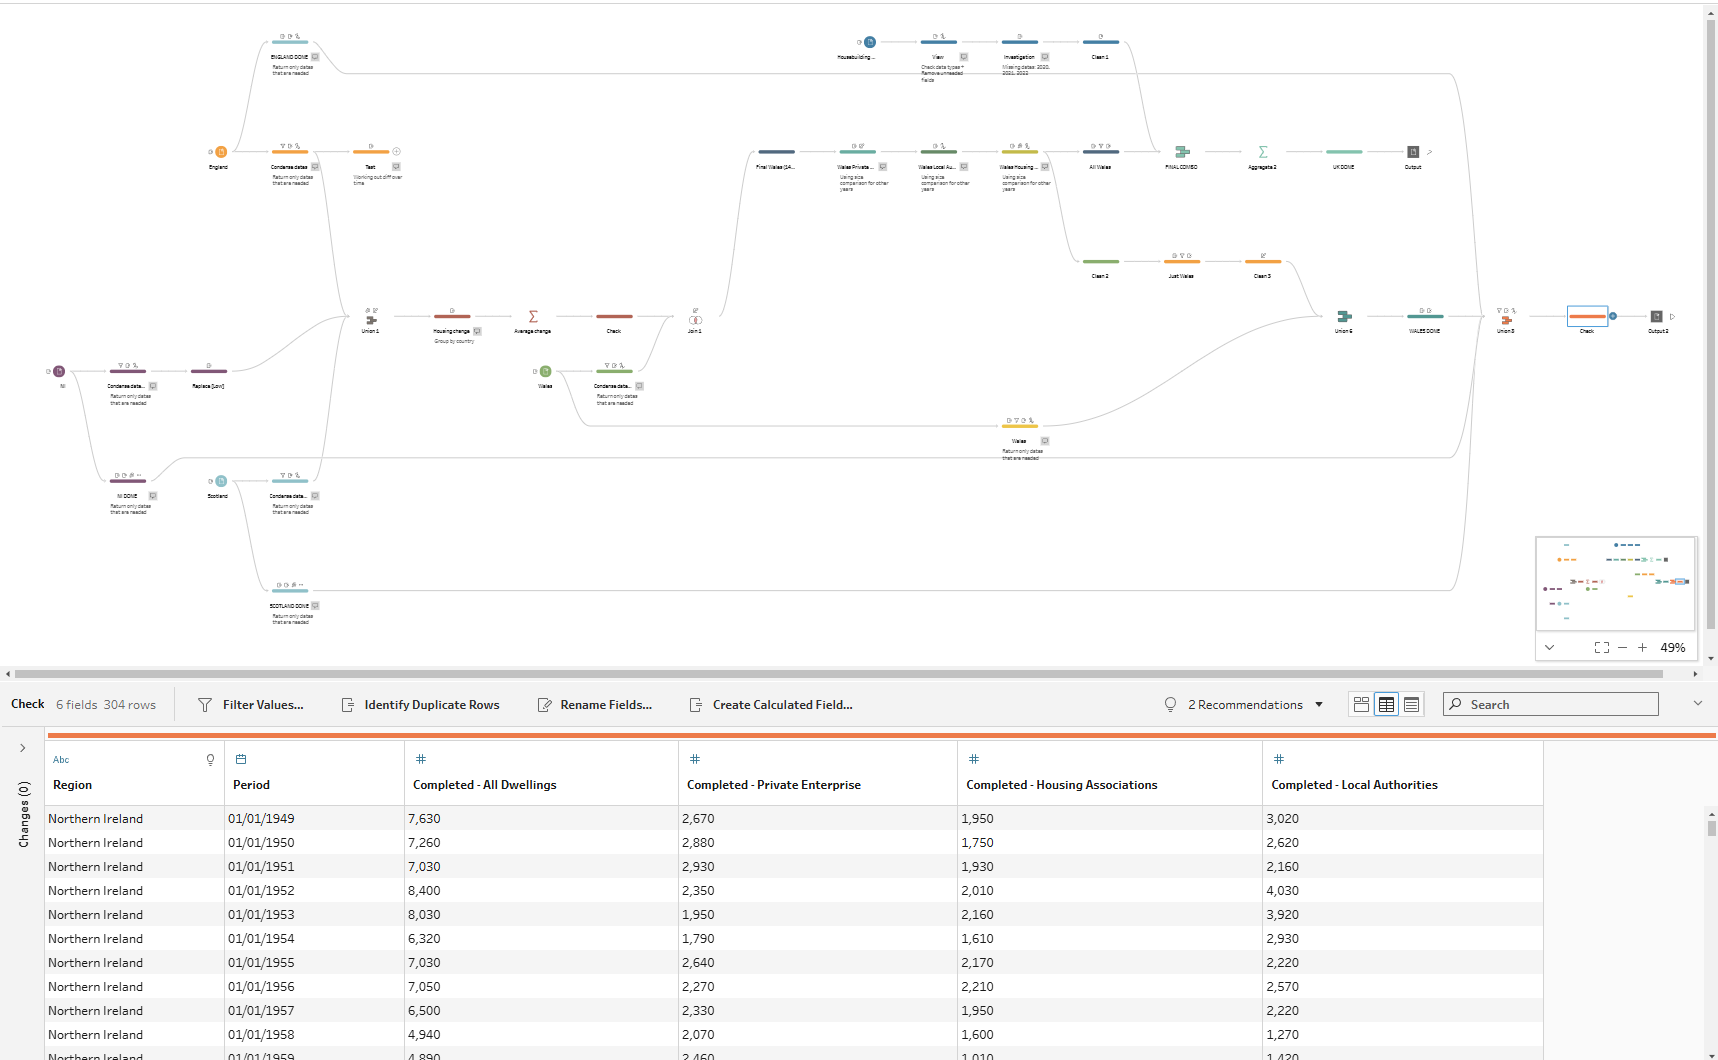
Continuing with this project, I now needed to clean the original data using Tableau Prep. Originally I had an excel file with four sheets of housebuilding data - one for each country in the UK. I started by looking at the structure of these and identifying any key issues:
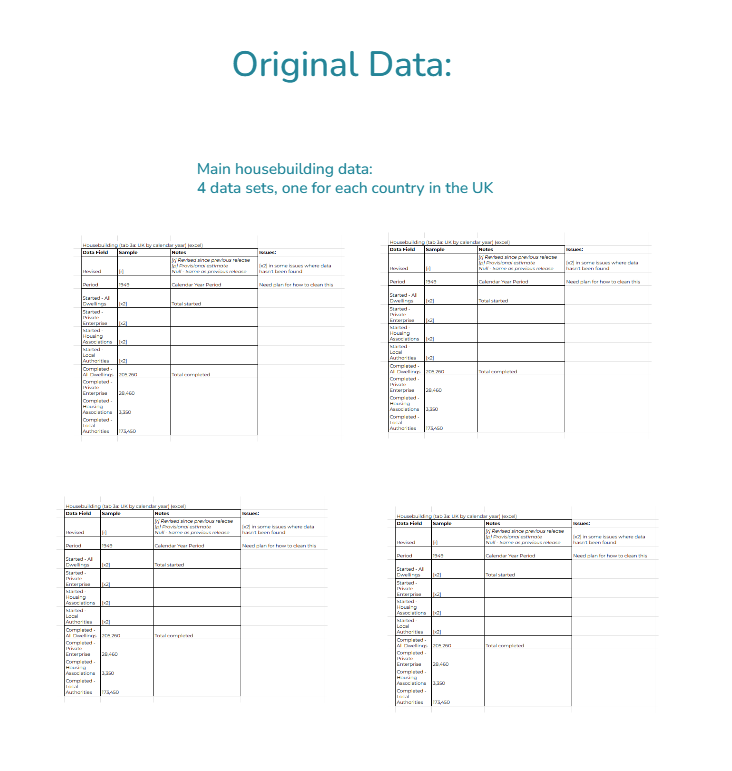
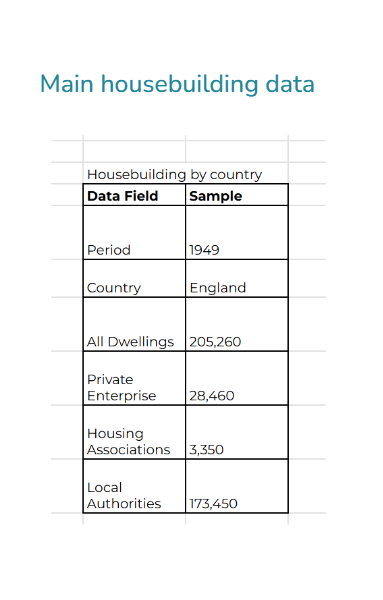
After looking at the data, I found lots of small simple changes I needed to make, as well as some larger issues that needed more creative solutions. I decided I wanted the final dataset to have the following structure:
Cleaning the data
When I started cleaning the housebuilding dataset I realised there were three rows of nulls in the data fields I wanted for the final dashboard. After some digging, I found that these were from the Wales dataset where the numbers weren’t available for those years (probably due to COVID).
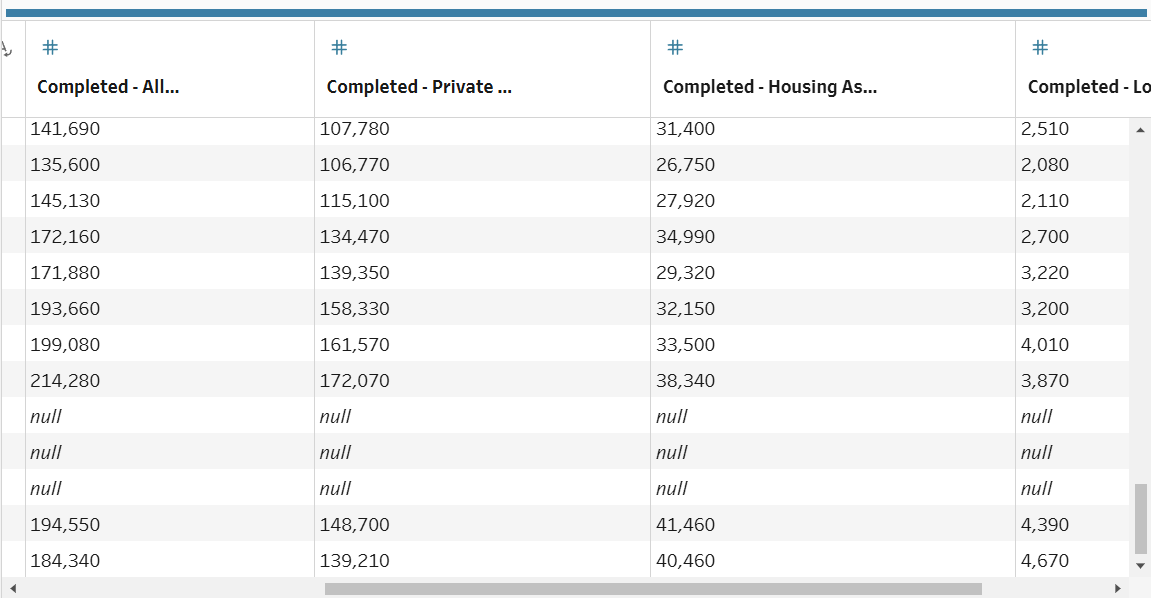
Elsewhere in the data I used a ‘fill down’ function if there was a singular missing value, but since this was a significant amount, I wanted to find values for these rows that were representative of the pattern of house building at the time. In other words, I wanted to find approximations for those missing values based on the values logged for the other countries in those years.
To do this:
- I filtered each country's dataset to only include the rows for 2019-2023 (the missing dates, the year before and the year after).
- I unioned the tables for England, Scotland and Northern Ireland and aggregated this to find the total houses built each year.
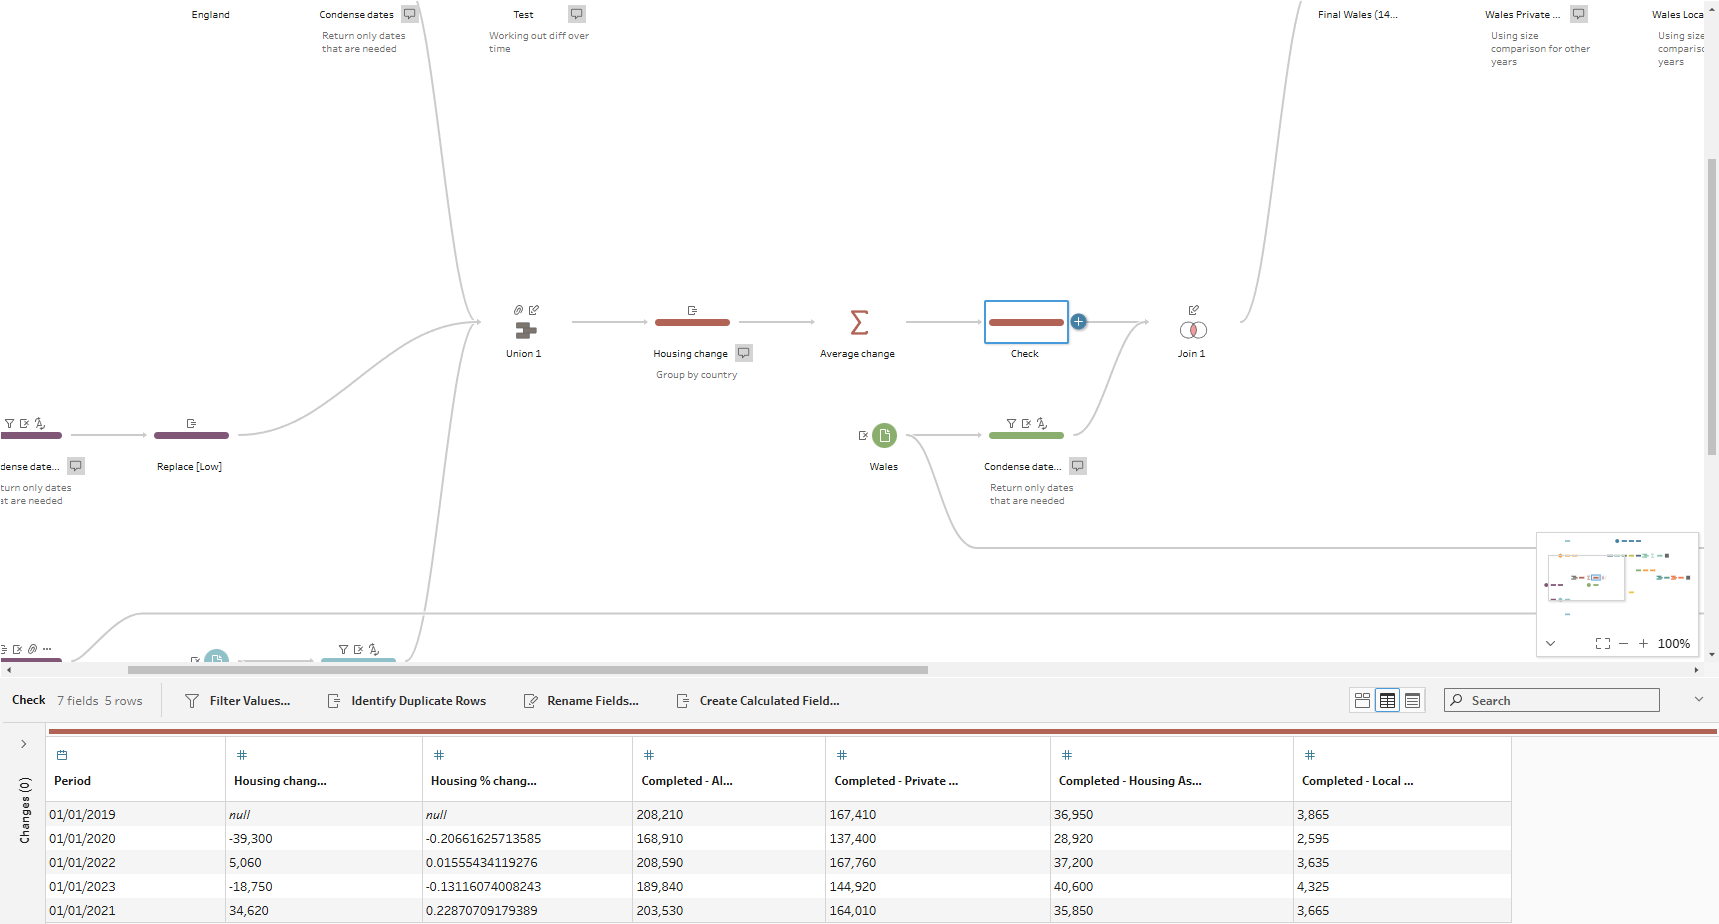
- I then joined this to the dataset for Wales (2019-2023).
- For each field (all dwellings, private enterprise, housing association and local authority) I did the following:
- Worked out the percentage difference in number of houses built for the years before and after the missing values
- Found the average percentage difference between these
- My new Wales estimates = avg % difference x total home built each year
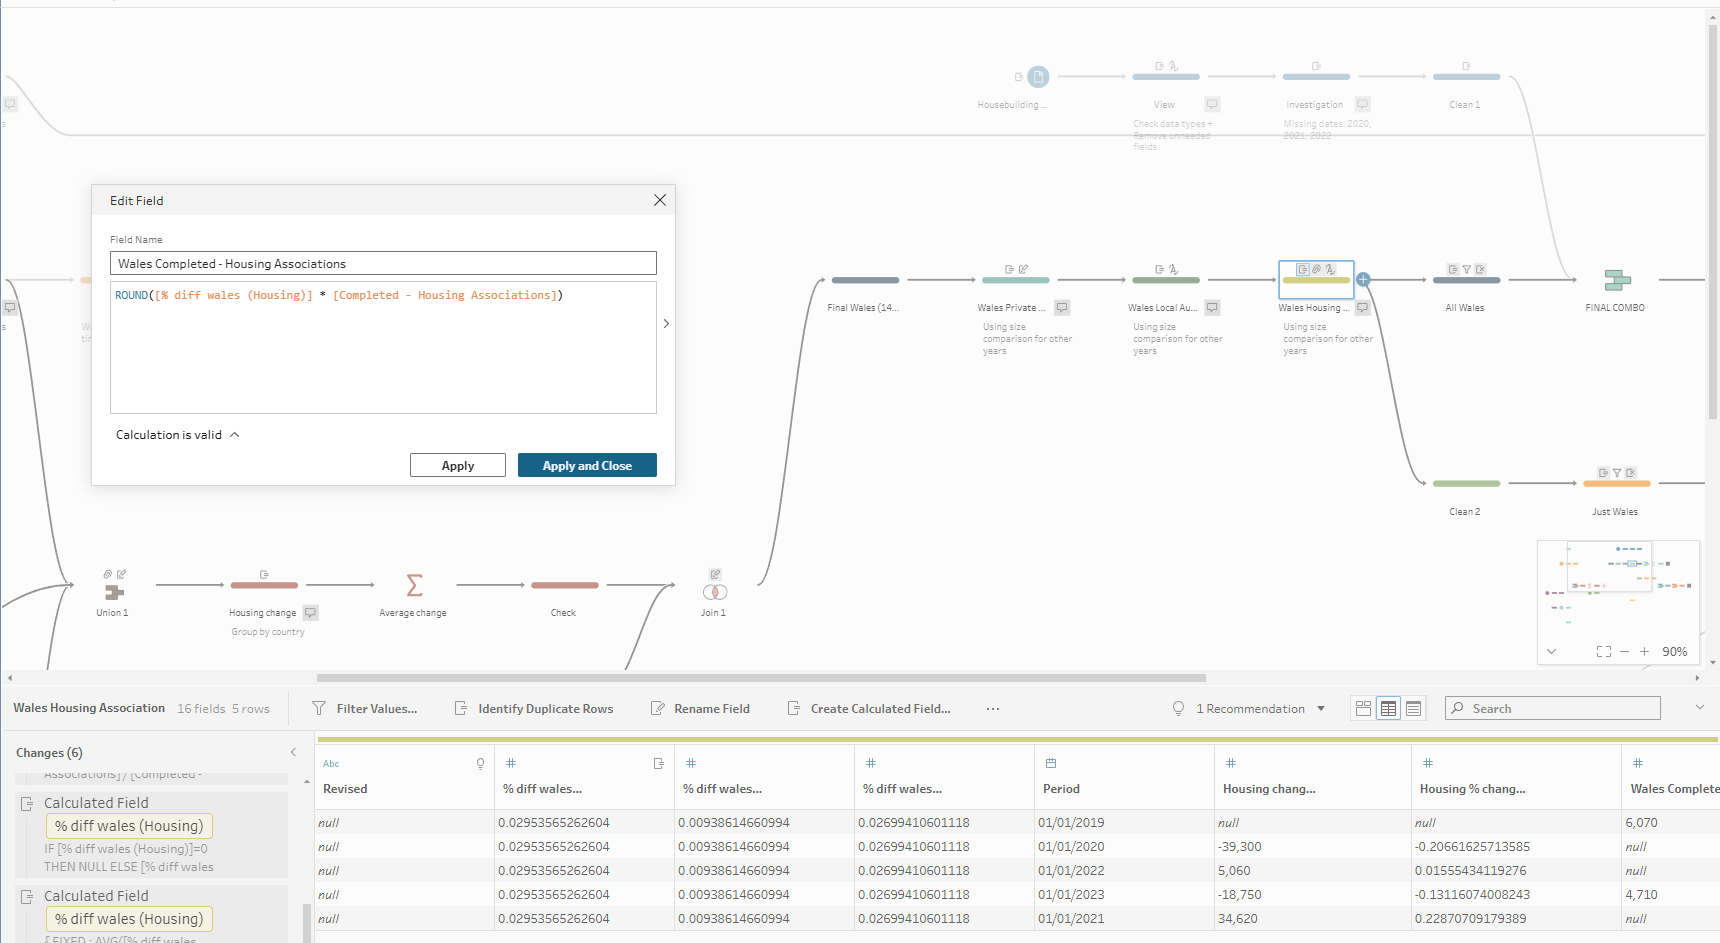
Finally I unioned the missing values with the Wales dataset, before combining this with the datasets for England, Scotland and Northern Ireland. The result was a clean dataset of houses built in the UK each year, within each country, broken down into those built by Private Enterprises, Local Authorities and Housing Associations.