I have been reworking a dashboard that I first created before I started at The Data School. It was my first ever use of Tableau and looked at house building in the UK between 1949 and 2025.
After cleaning the main dataset for the dashboard (which you can read about here), I needed to bring in additional data. This involved adjusting economic data for inflation and using RegEx to parse columns.
Planning the model
Once I had found sources for the data I needed, I planned the model I wanted to create. The data I had currently looked like this:
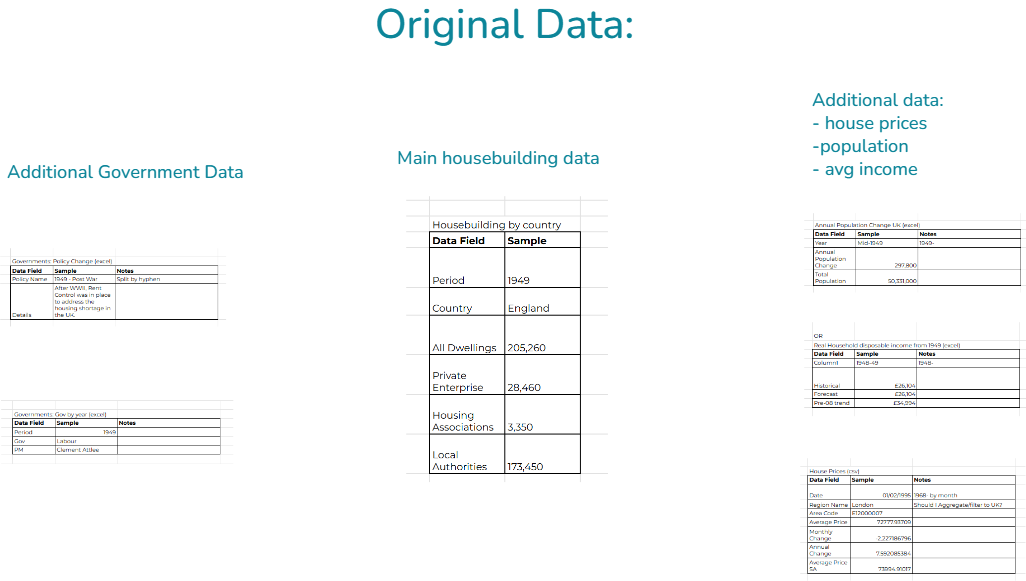
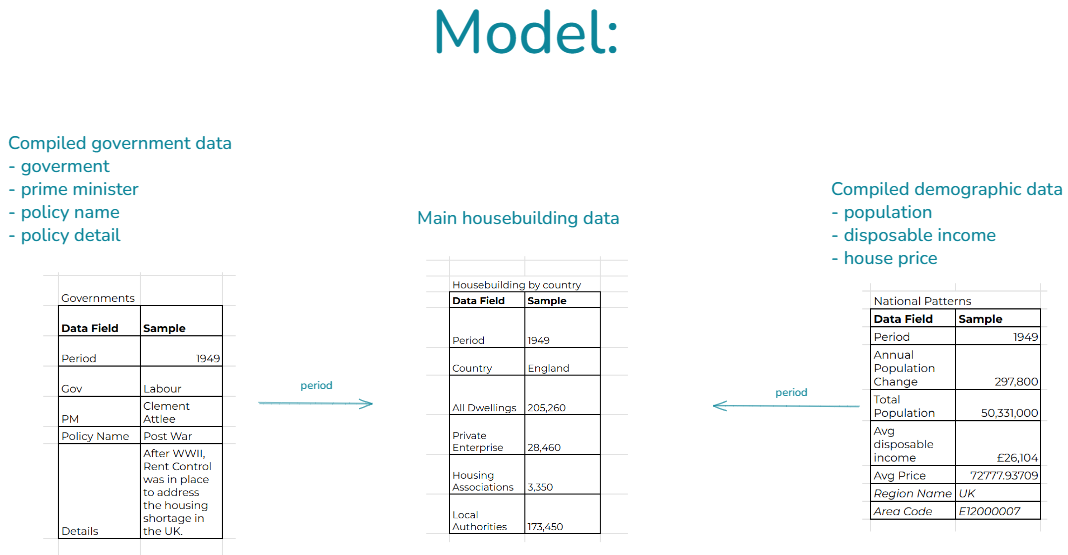
I decided I wanted to transform this into three clean (main housebuilding data, government data and demographic data) datasets which related by a yearly date field. My goal was for it to look like this:
Adjusting for inflation
For the demographic dataset, the additional data I wanted included house prices and income, between 1950 and 2025.
After looking for the data I needed online, I found Real disposable income and Nominal house prices for this time period. However, I wanted Equivalised Disposable Income and Real House Prices.
It was only after researching that I actually found out what this terminology means and was able to work out this end goal, so I’ll summarise it here:
Nominal Price: The price as it was at the time
Real Price: The price adjusted for inflation.
Equivalised Price: (specifically for income) The Real price taking average household sizes into account.
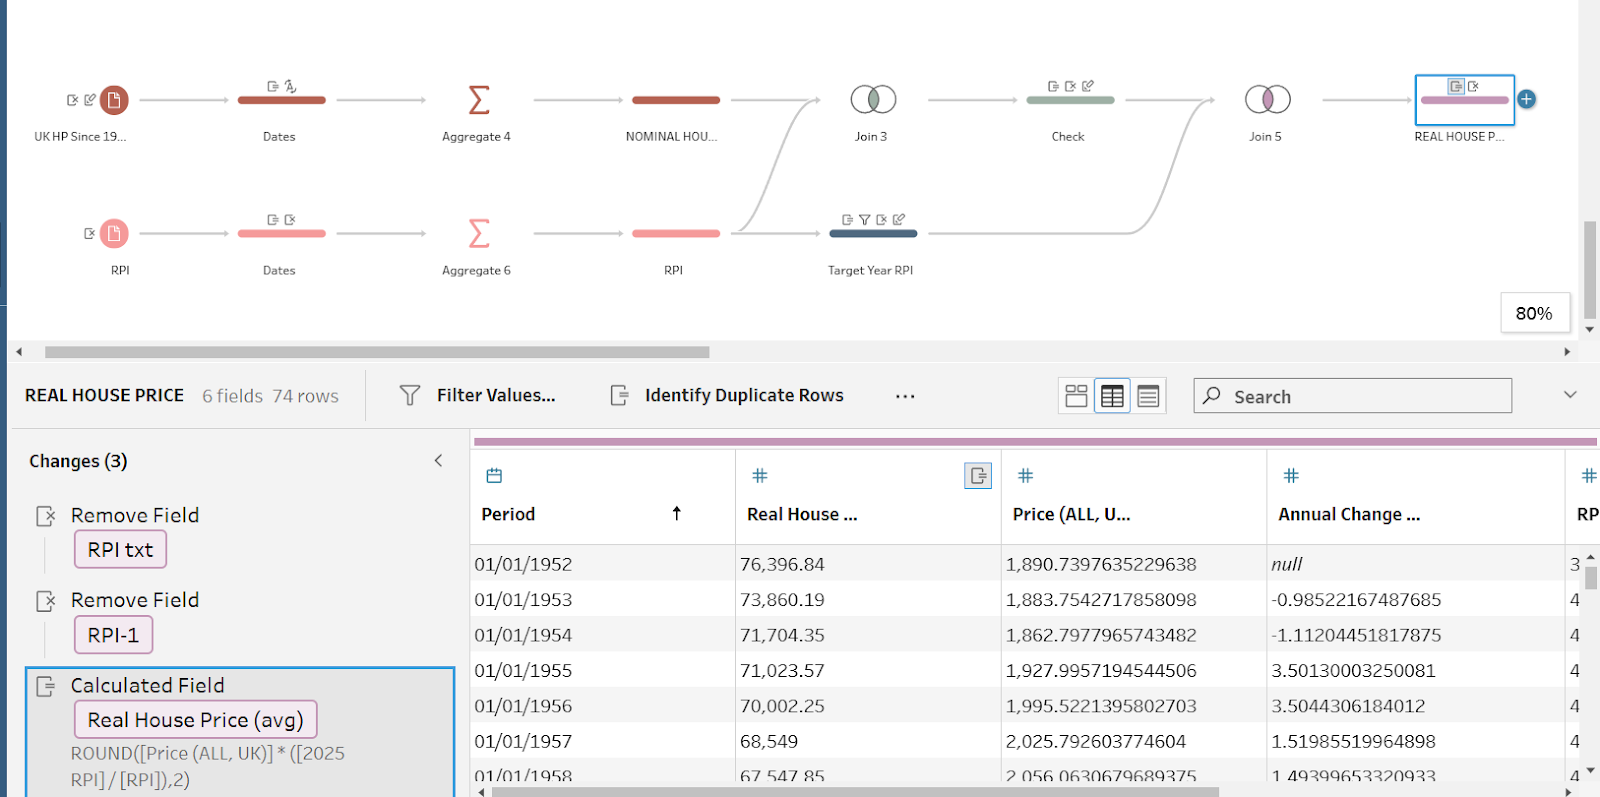
Real House Prices
First I cleaned my House Price dataset using Tableau Prep to calculate the Real House Price (avg) for each year. To do this, I found a quarterly price index (RPI) online and aggregated this to the yearly date. Then I joined this to my House Price dataset and used the following equation to calculate the Real House Price:
Real Price = Nominal Price x (Target Year Index / Original Year Index)
Equivalised Income
Once I knew what I was looking for, I managed to find a dataset online for Equivalised Income. However, this only covered the period of 1961-2025, and I wanted the data to go back to 1950. In order to do this, I needed to use the Real Data to back date these missing years. First I found the % difference between the Equivalised and Real data for the years I had available. Then I applied the % difference to the missing dates (1950-1960).
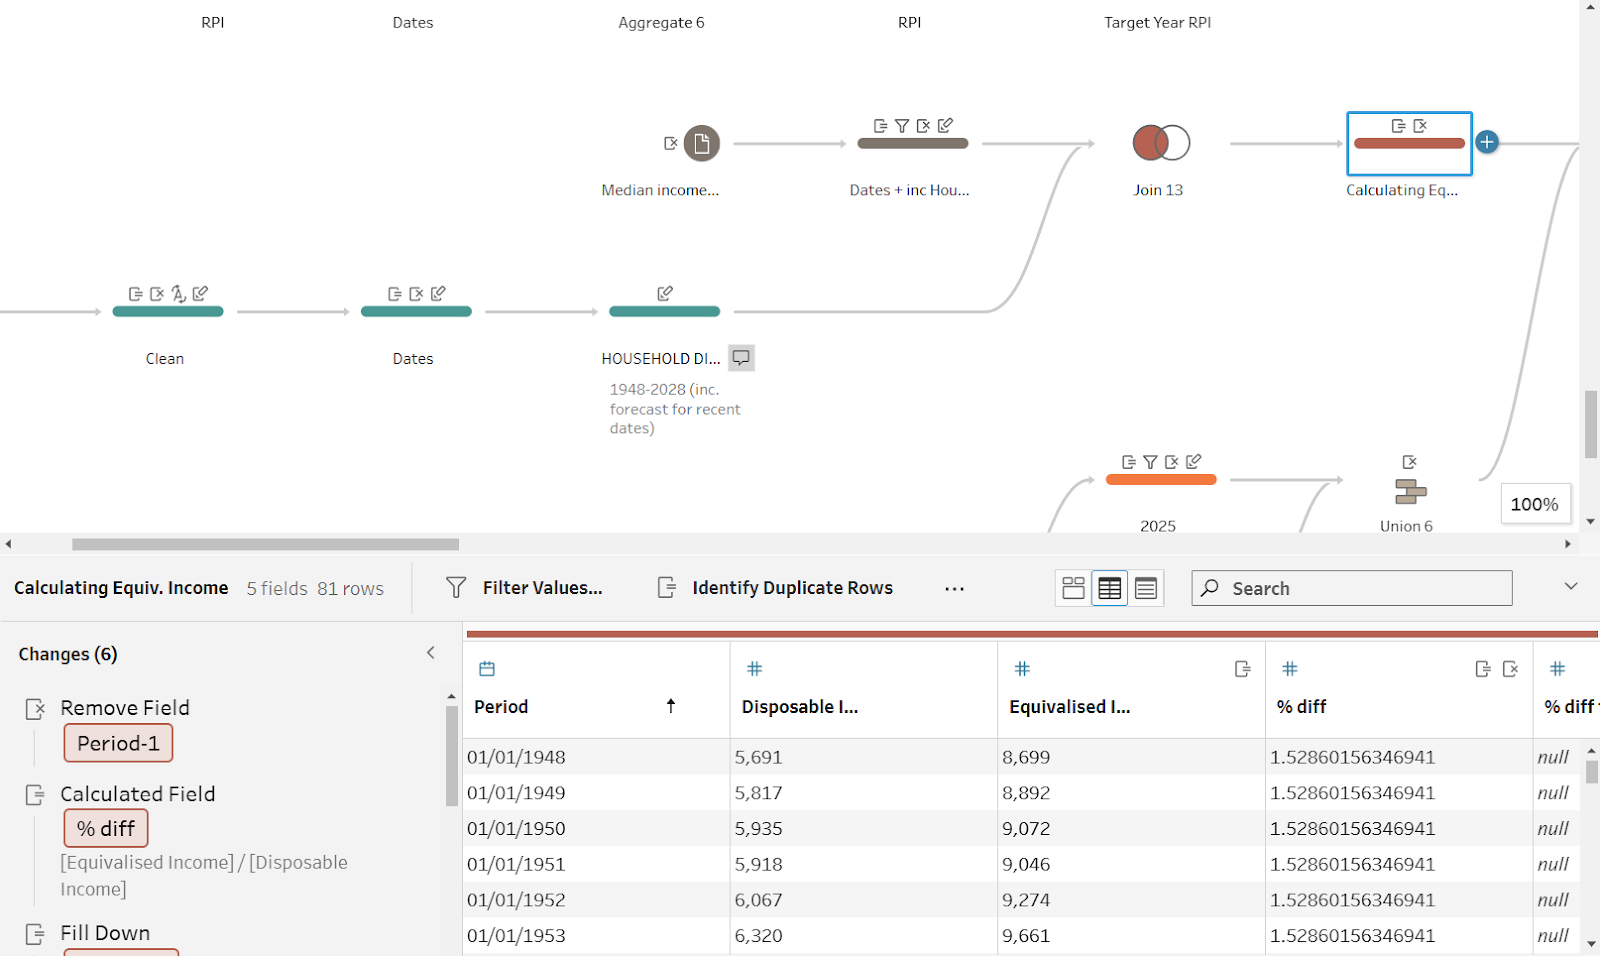
Now that I had the data as representative as possible, I joined my data together into a dataset that I called National Trends, ready to add to my data model in Tableau Desktop.
Using RegEx to Clean Data
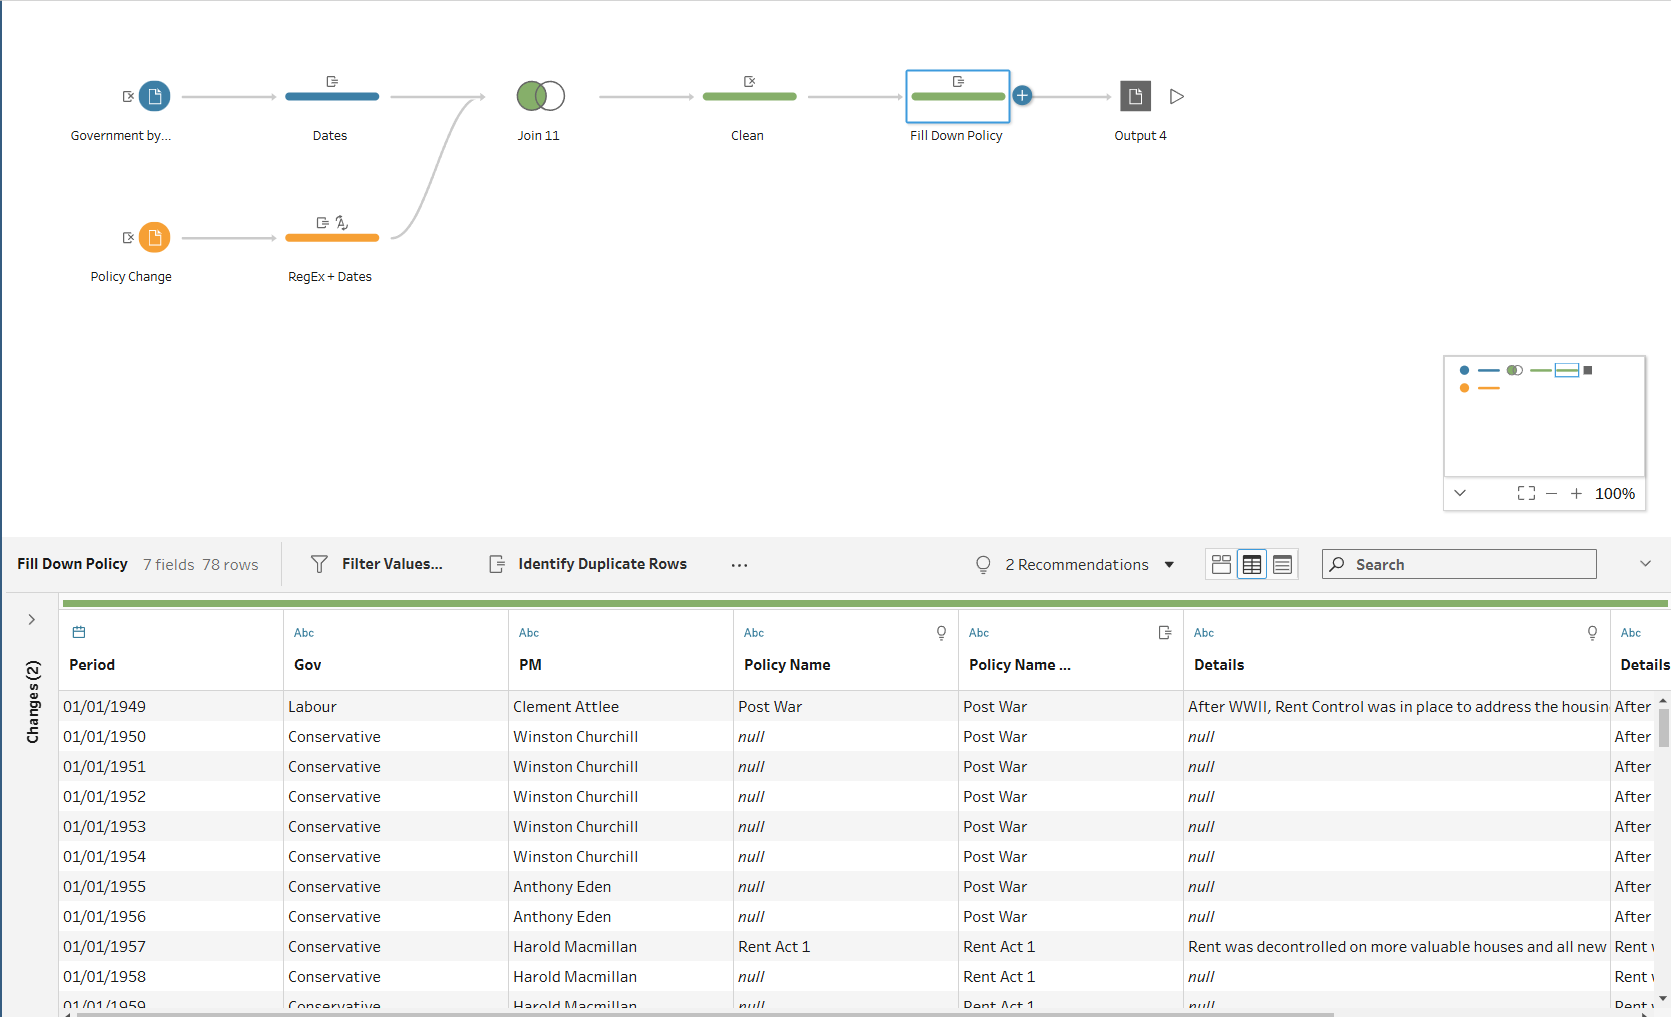
In the housing dashboard I have recently been working on, I wanted to incorporate government and policy data that I collected a while ago and stored in a very messy format before I had learned about data cleaning best practices.
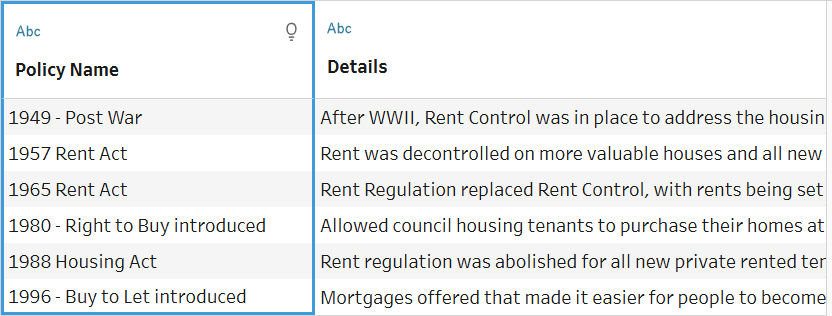
Since the orignal data didn’t consistently use a hyphen between the date and policy name, I couldn’t use the Automatic Split function. Rather than going back to the original document and manually changing each entry, I decided to use my new RegEx skills to quickly fix this in Tableau Prep.
First I had to work out the RegEx code for the columns. Using RegEx Website Link and some trial and error, I found the following code for my text:
[0-9]{4}\W+[A-Z].{1,}
Then I used the REGEXP_ETRACT function in Tableau Prep, with brackets around the relevant parts of this code, to create new datafields for Date and Policy Name:
- Date: REGEXP_EXTRACT([Policy Name], '([0-9]{4})\W+[A-Z].{1,}')
- Name: REGEXP_EXTRACT([Policy Name], '[0-9]{4}\W+([A-Z].{1,})')
Once I had done this, I joined the data to a table which included the government and prime minister for each year. The resulting set included a row for every year, with details about the government, prime minister, and housing policy: