On Day 4, we were set the 2-day challenge of completing the #DataPlusMovies Challenge using IMDB Data, I was excited for this one as I thoroughly enjoy all kinds of films. However this made narrowing down my scope a little harder!
I started of by creating a plan for the 2 days:

After Downloading the Data set, I knew that I wanted to narrow my scope down to a particular Producer: A24. The Data set was very large and took a while to process in Tableau/Prep. So I started off sketching some ideas based on a user story, shown below:
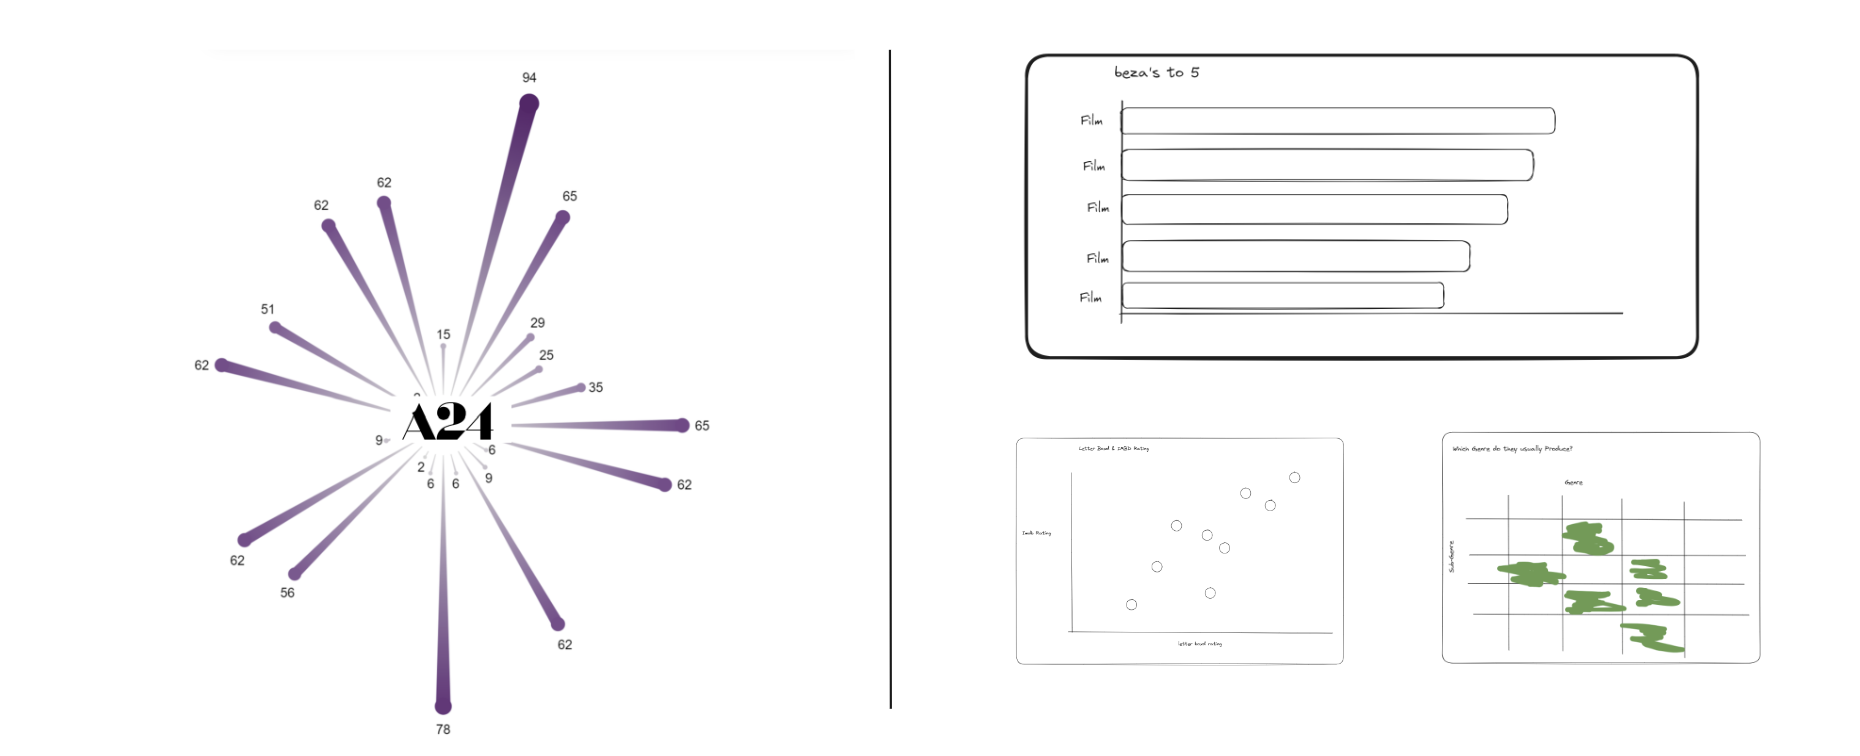
I had initially wanted to create a 'Recommendation Metric' by adding in Data of the films I had watched and rated highly, then find similarities and generate recommendations. Unfortunately with the limited time frame and given data set, was not a possibility (but will definitely be coming back to this as a passion project!)
I then prepared the data using Tableau Prep, to join on Letterboxd Ratings and My own, as well as aggregating the data so that each row was a different film.
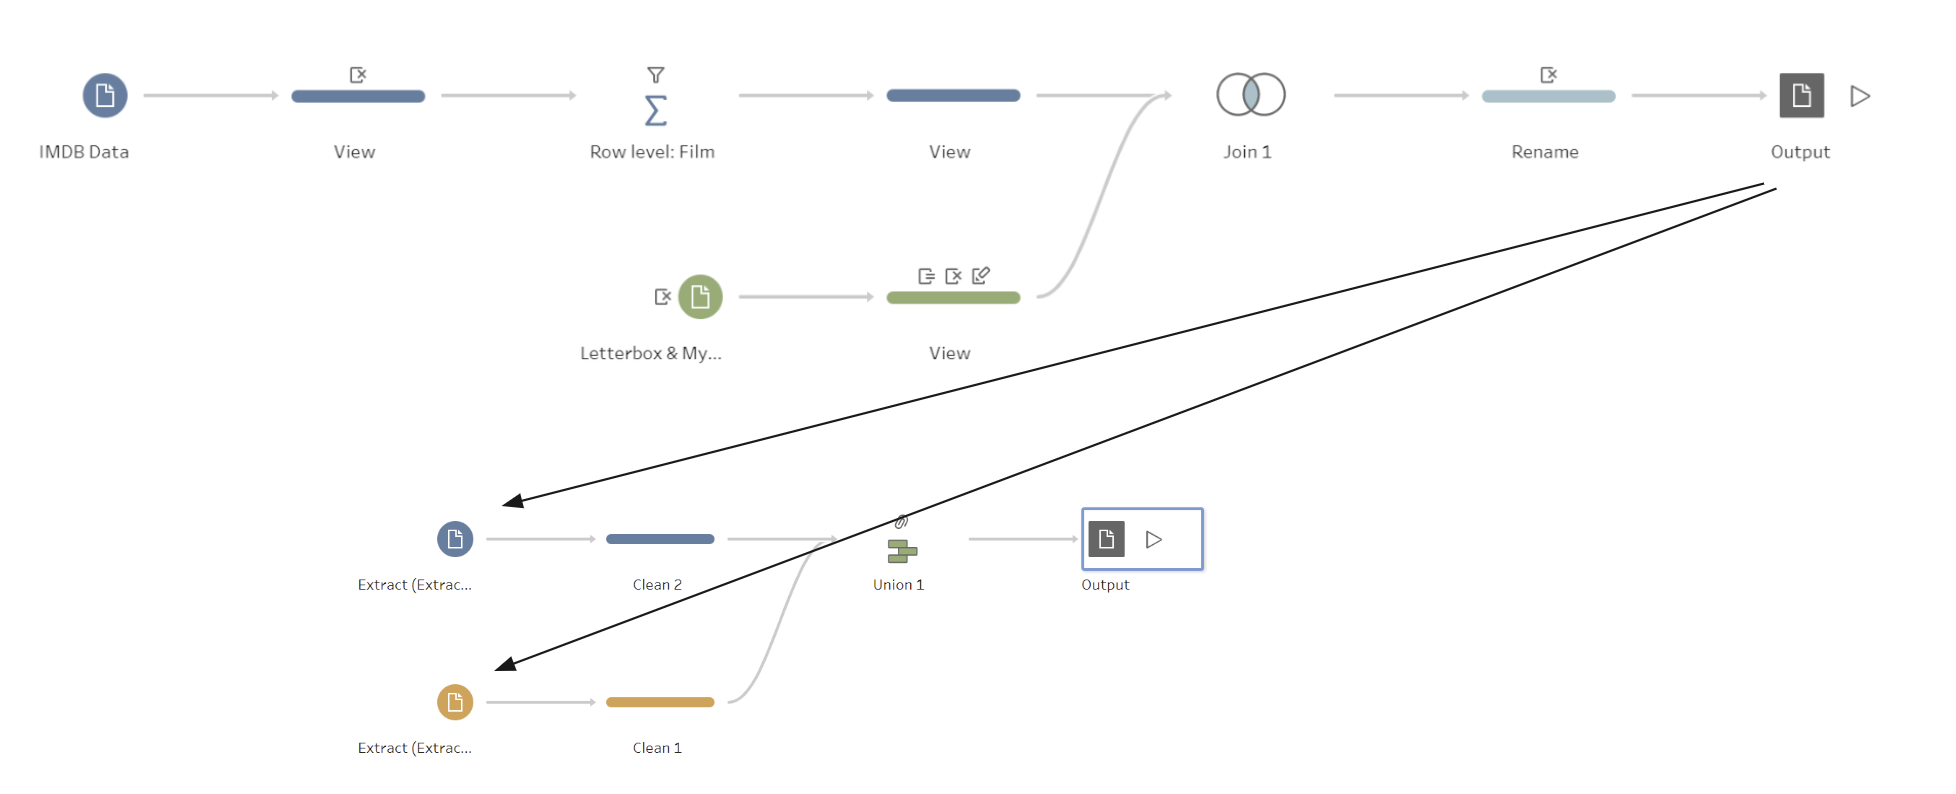
Then the final data was unionid onto itself to create the starburst chart. This was created using the following tutorial: https://www.youtube.com/watch?v=d6-aptKLvgg
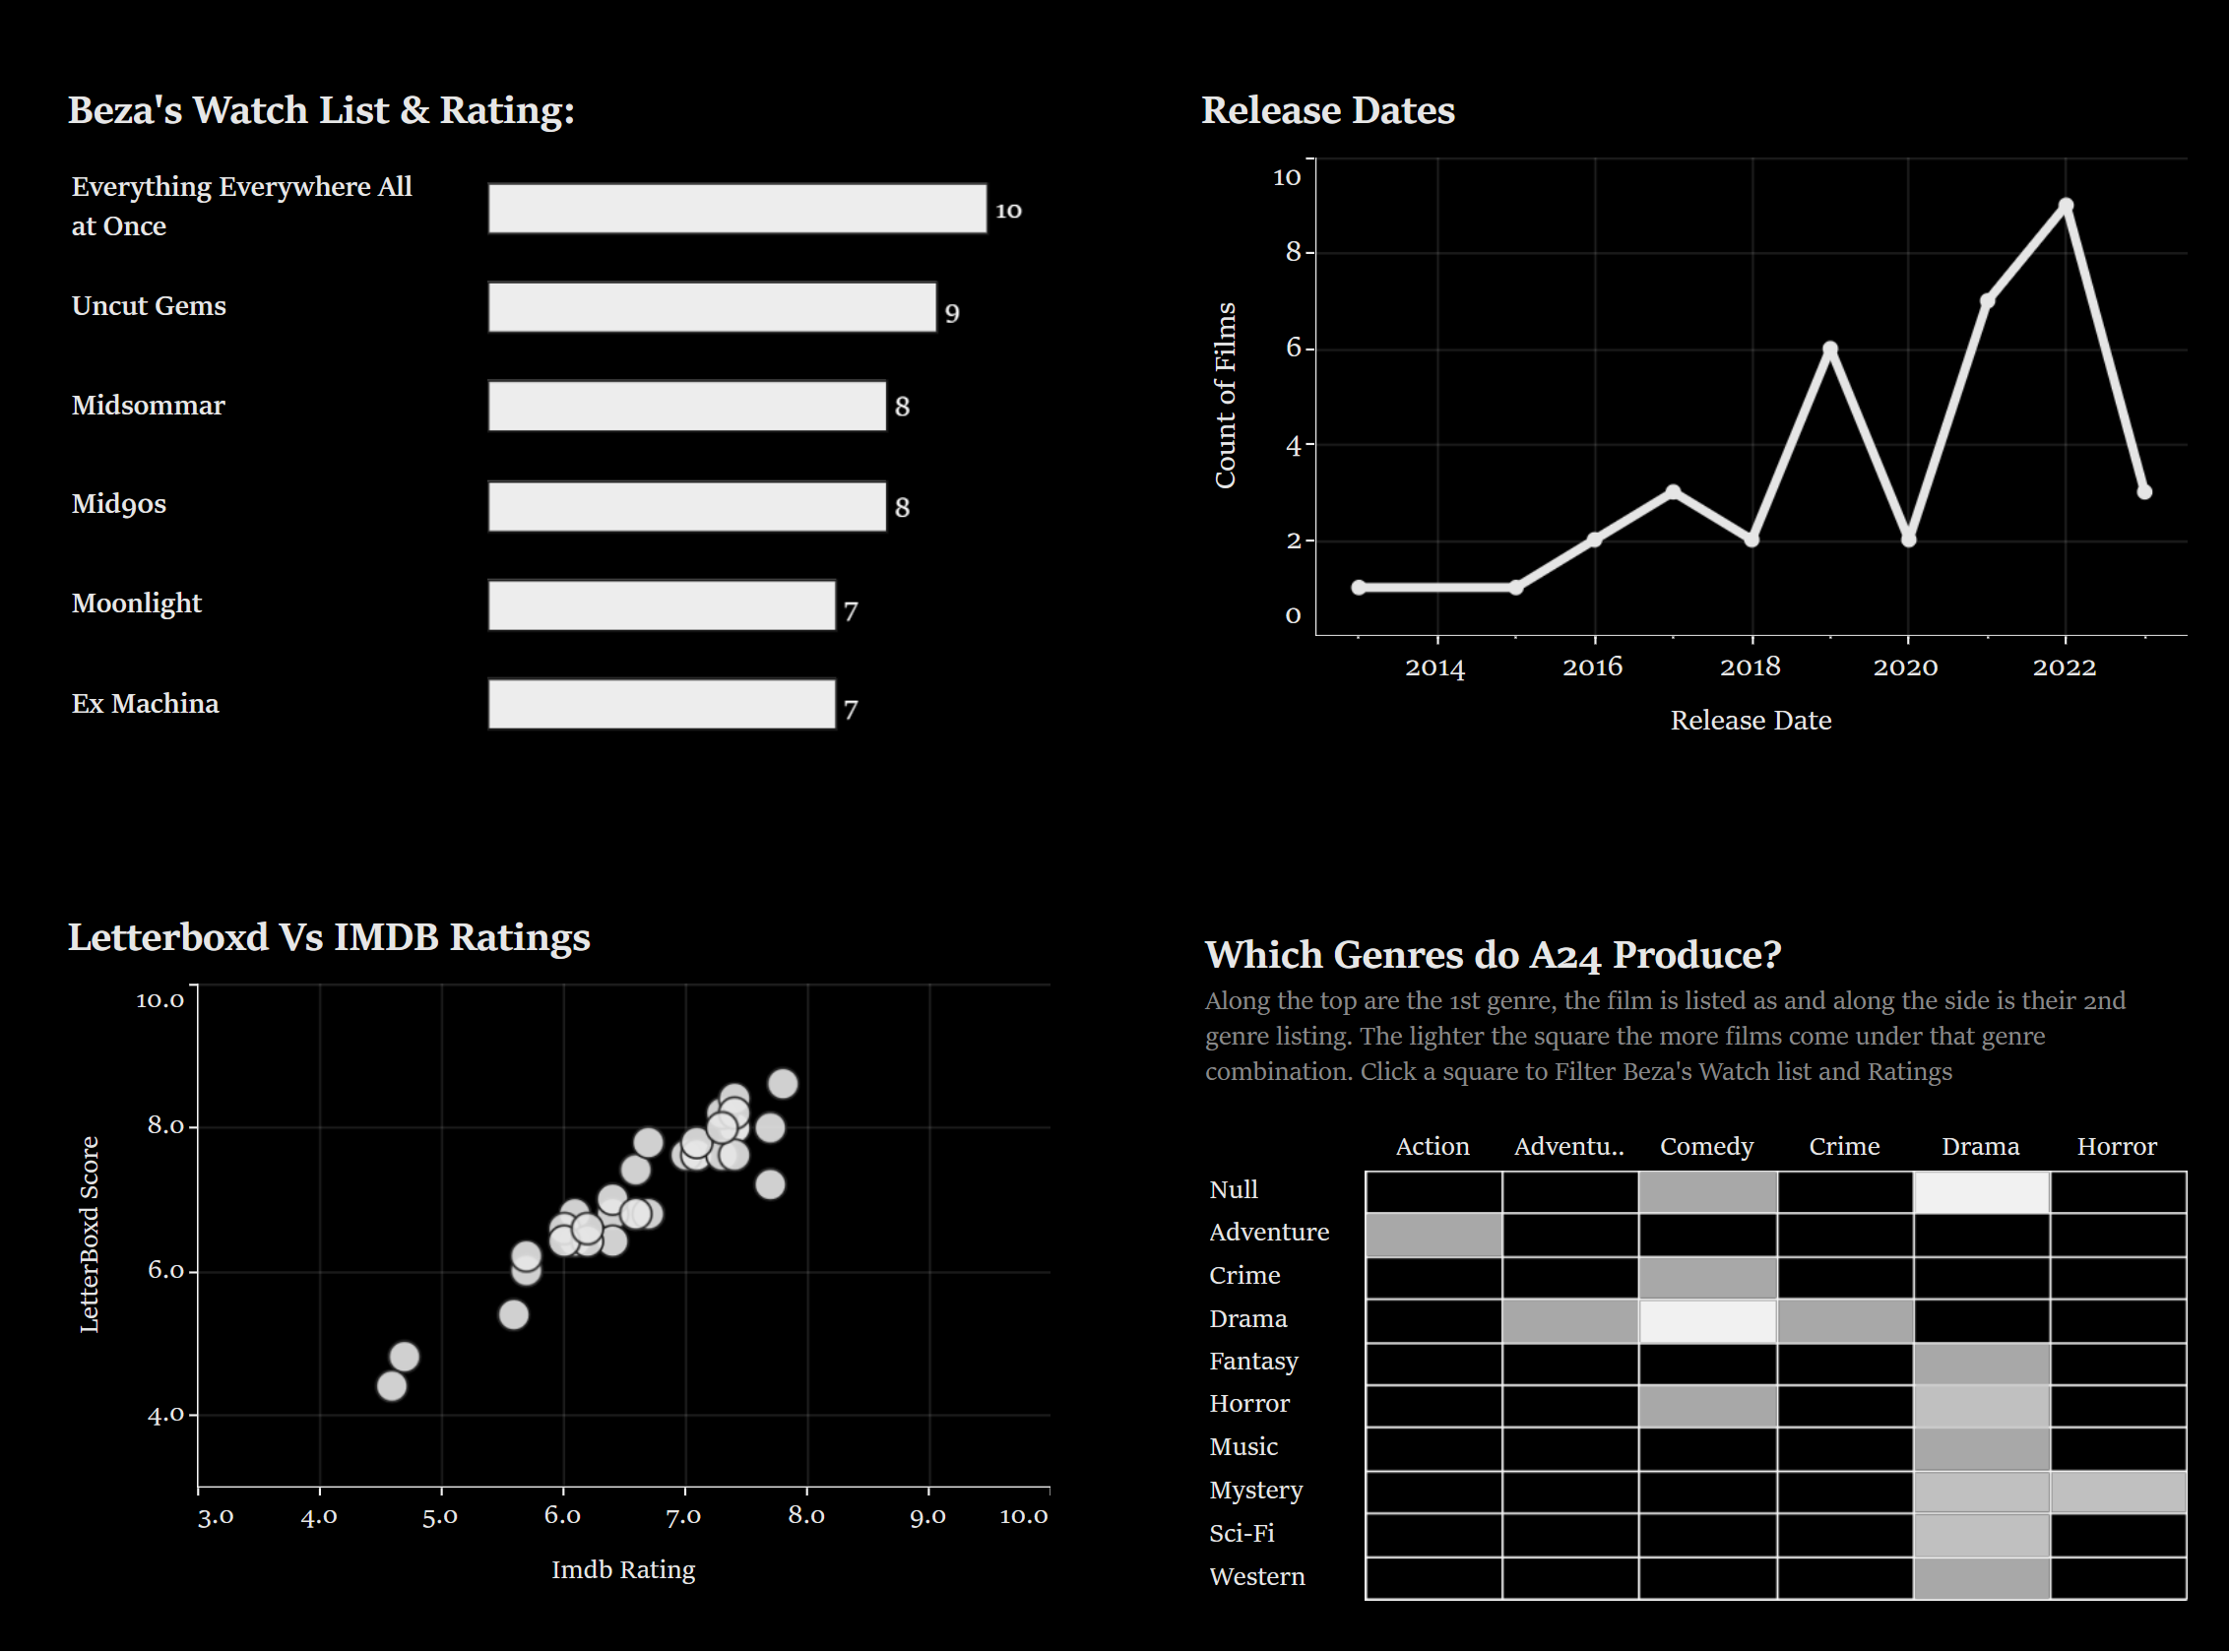
I was then able to finally go into Tableau to create my charts and used Figma for design to produce: