


When working with time-based data in Tableau, having a set of reliable calculations for monthly and yearly analysis can make a significant difference. These calculations are particularly useful for isolating specific periods, creating default views, and allowing users to control the time frame they are analysing.
Note: The examples below focus on selecting and analysing a single month. While this is often described alongside Month-on-Month (MoM) or Year-on-Year (YoY) analysis, it is important to note that this approach does not calculate a comparison or variance between periods. Instead, it provides the foundation that full MoM or YoY calculations build upon.
Customising Month Labels
If you want to display only the first letter of the month (for example, J for January, F for February), you can use the following date format: MMMMM
Selecting a Month for Analysis
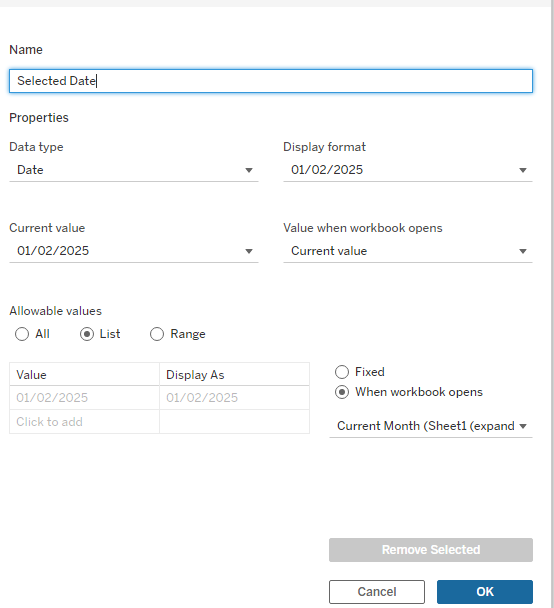
To allow users to focus on a specific reporting month, you can create a date parameter that lets them select which month they want to analyse.
This technique is commonly used in dashboards that show:
- A single reporting period
- Headline KPIs
- Monthly summaries that do not require direct period comparison
Linking the Selected Month to the Data
Once the parameter has been created, a calculated field is required to link the selected month to the date field in the data.
e.g:
DATETRUNC('month', [Date]) = DATETRUNC('month', [Selected Date])
This calculation truncates both dates to the month level, ensuring that all records belonging to the selected month are included, regardless of the specific day.
Identifying the Current or Most Recent Month
In many dashboards, it is helpful to automatically focus on the most recent month of available data, particularly when a user first opens the view.
The following calculation can be used to identify the current or latest month:
e.g:
DATE({ MAX(DATETRUNC('month', TODAY())) })
This can also be used to default a date parameter so the dashboard always opens on the most up-to-date reporting period.
Creating a Selected Month Measure Calculation
To return a measure value for the selected month, you can create a calculated field that evaluates the measure against the selected date.
For example, a Selected Month Volume calculation would:
- Return Volume for the chosen month
- Update dynamically as the parameter changes
The same pattern can be reused for other measures such as Sales, Profit, or Revenue by simply replacing the measure field.
How This Differs from Full MoM or YoY Analysis
While this approach is often used alongside MoM or YoY analysis, it is important to understand the distinction:
- This method isolates a single reporting period
- It does not calculate change, variance, or percentage difference
- No previous month or prior year is being referenced
Instead, this technique is best thought of as a building block. Full MoM or YoY calculations extend this logic by introducing an additional time period and calculating the difference between the two.
These calculations are extremely useful for creating clean, user-driven dashboards that focus on a specific reporting period. By isolating a selected month and defaulting to the most recent data, you can build clear and intuitive views that are easy for users to understand.
Once this foundation is in place, it can be extended further into full Month-on-Month or Year-on-Year analysis where required.