


In Tableau, a common analytical requirement is identifying the top or bottom N values within a dimension based on a chosen measure. This technique is particularly useful when you want to focus attention on best or worst performers without overwhelming the view.
In this example:
- The dimension is Associate Brand, used to break down the data
- The measure is Volume, which determines the ranking
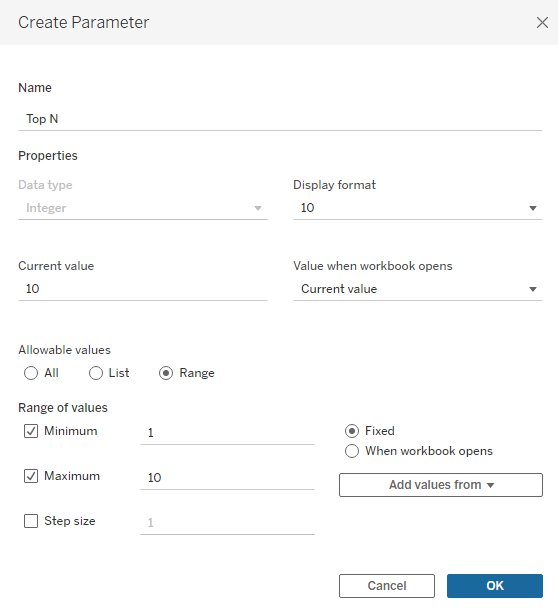
Step 1: Create a Parameter for Top N
Start by creating a parameter that allows the user to define how many values they want to see.
This parameter controls the value of N (for example, Top 5, Top 10, etc.).
When creating the parameter:
- Set the Data Type to Integer
- Choose a sensible current value
- Optionally define a range to limit how large or small N can be
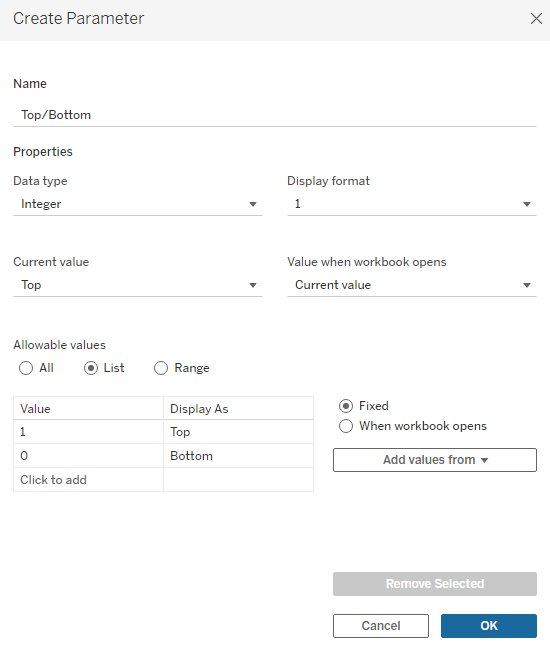
Step 2: Create a Parameter to Switch Between Top and Bottom
Next, create a second parameter that allows the user to choose whether they want to see the Top N or Bottom N values.
This parameter typically uses:
- A String or Integer data type
- Two values, such as Top and Bottom (or 1 and 0)
Clear labelling is important here so users immediately understand what they are selecting.
Step 3: Create Sets on the Chosen Dimension
Now create sets on your chosen dimension (in this case, Associate Brand). You will need two sets:
- One for Top N
- One for Bottom N
Each set should be created based on a field, using the measure that determines ranking — in this example, Volume.
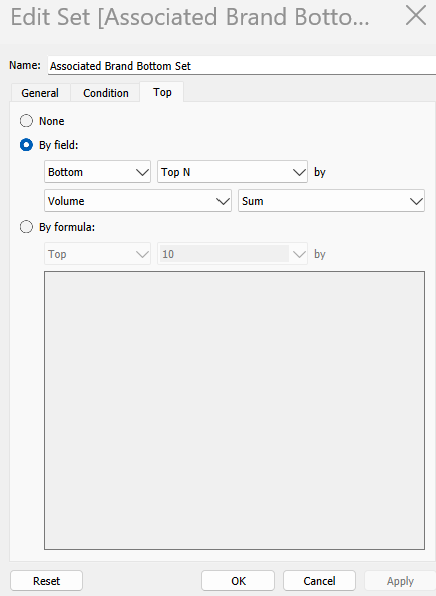
Bottom N Set
Create a set on the dimension and configure it to include the bottom N based on the Volume measure.
Top N Set
Create a second set on the same dimension, configured to include the top N based on the Volume measure.
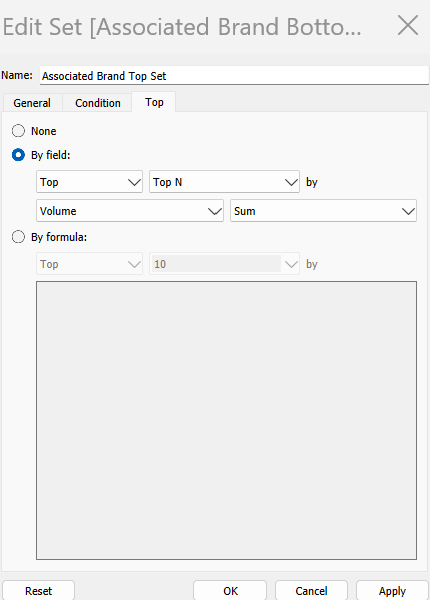
These sets will dynamically respond to changes in the Top N parameter.
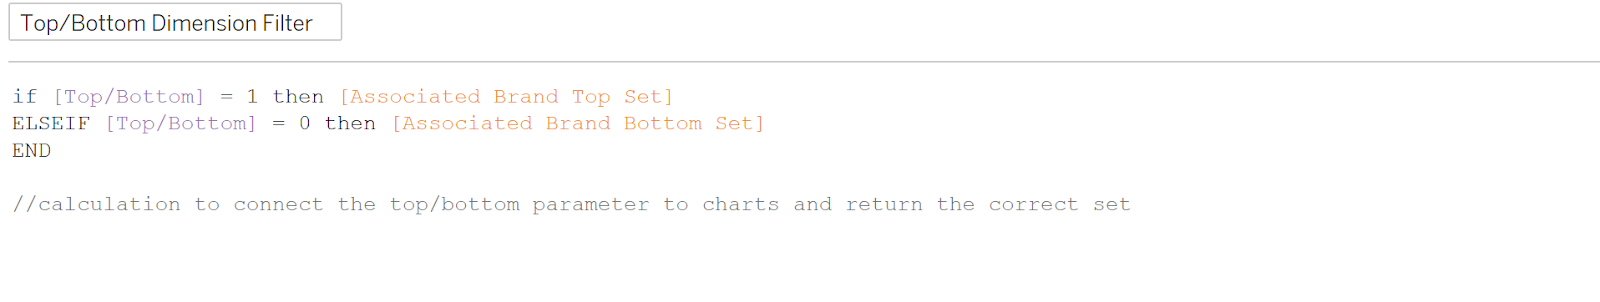
Step 4: Create a Calculated Field to Link the Parameter to the Sets
Next, create a calculated field that connects the Top/Bottom parameter to the sets you have just created.
This calculation evaluates the parameter value and determines which set should be used.
When creating this calculation:
- Ensure the 1 and 0 values (or equivalent) match exactly with those used in the Top/Bottom parameter
- Confirm that each value correctly maps to the corresponding Top or Bottom set
This step is critical — mismatched values will prevent the calculation from working as expected.
Step 5: Build the View and Apply the Filter
Now build your view using your dimension and measure as required.
Add the calculated field (for example, Top/Bottom Dimension Filter) to the Filters shelf and filter it to True.
This ensures that only the values from the selected Top or Bottom set are displayed in the chart.
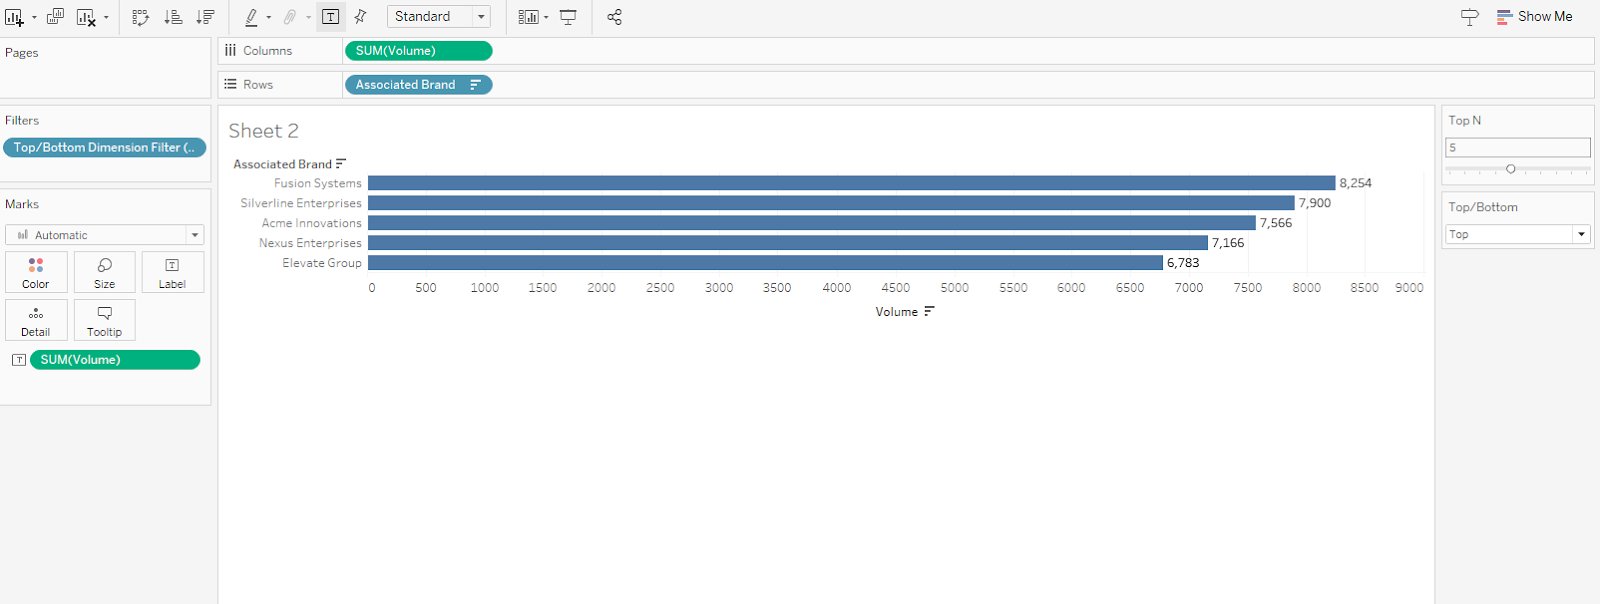
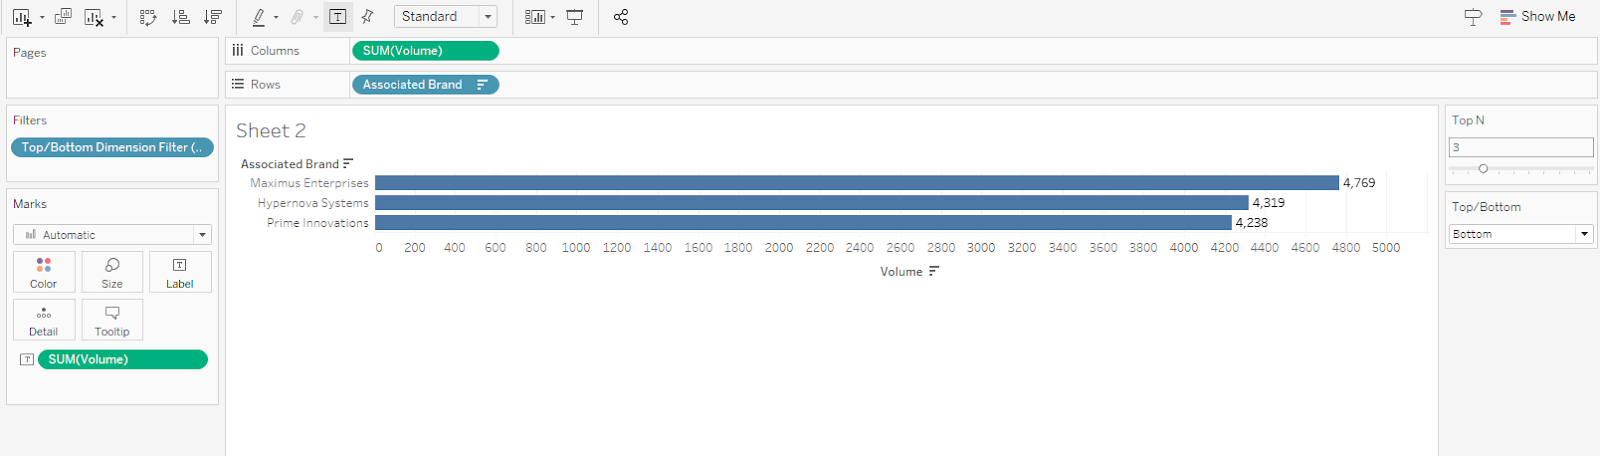
Step 6: Show the Parameters and Interact with the View
Once both parameters are shown:
- The user can switch between Top and Bottom
- The user can change how many values are displayed
- The view updates dynamically based on their selections
This allows for flexible exploration of the data without the need for multiple worksheets.
Important Consideration: Order of Operations
It is important to be mindful of Tableau’s order of operations when using this approach.
For example:
- If you are also using a data source parameter or other filters
- You may need to add certain filters to Context
- This ensures the Top/Bottom logic is applied after the appropriate data has been filtered
Managing context filters correctly helps ensure the chart behaves in a predictable and meaningful way