


A common challenge in Tableau is wanting to allow users to explore data from different perspectives without cluttering the view with multiple dimensions or duplicating worksheets. This is where dimension switching using parameters becomes extremely useful.
By combining a parameter with a calculated field, you can give end users control over which dimension they want to analyse, all within a single view.
Step 1: Create a Parameter for Dimension Selection
The first step is to create a parameter that will act as the control for the user.
This parameter represents the different dimension options the user can switch between (for example: Category, Region, or Segment).
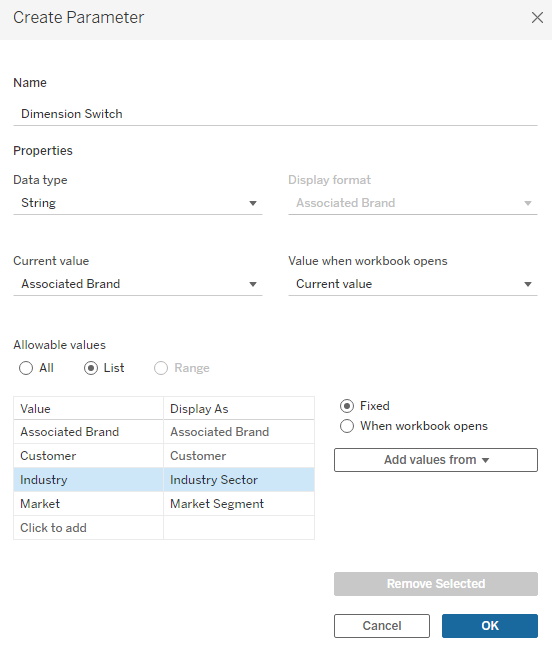
When creating the parameter:
- Set the Data Type to String
- Add a list of Allowable Values that match the dimension names you want to switch between
- Use clear, user-friendly labels so it is obvious what each option represents
Once created, this parameter can be shown to users as a drop-down selector or control on the dashboard.
Step 2: Create a Calculated Field to Link the Parameter
Next, you need a calculated field that links the parameter to the underlying dimensions in the data.
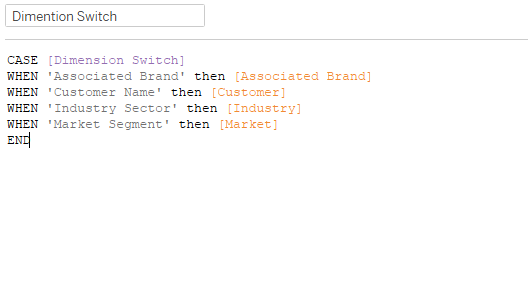
This calculated field evaluates the parameter selection and returns the appropriate dimension value. This can be achieved using either an IF statement or a CASE statement.
For example, the calculation checks:
- If the parameter equals “Customer”, return the Customer field
- If it equals “Market”, return the Market field
- And so on
This calculated field acts as the connection between user input and what is displayed in the view.
Step 3: Use the Calculated Field in the View
Instead of placing multiple dimensions on Rows, Columns, or Marks, you now use the calculated field you have created.
When the parameter control is shown:
- The view updates dynamically
- The selected dimension changes instantly
- No additional worksheets or duplicated visuals are required
This keeps the workbook clean and makes the experience more intuitive for end users—particularly when there is no need to compare multiple dimensions at the same time.
Why Use Dimension Switching?
Dimension switching is especially useful when:
- Only one dimension needs to be analysed at a time
- Screen space is limited
- You want to reduce visual clutter
- You want to enable self-service exploration without overwhelming users
Common Use Cases for Dimension Switching
Below are some practical scenarios where this technique works particularly well:
1. Executive Dashboards
Allow stakeholders to switch between views such as Region, Department, or Product Line without navigating to multiple dashboards.
2. Sales Analysis
Enable users to analyse performance by Sales Representative, Customer, or Territory within a single chart.
3. Time-Based Analysis
Allow switching between Year, Quarter, and Month when direct comparison across time levels is not required.
4. Self-Service Analytics
Provide business users with the flexibility to explore data independently without the need for multiple pre-built worksheets.
5. Space-Constrained Dashboards
Ideal for mobile dashboards or embedded views where space is at a premium.