


This week is dashboard week at the Data School, which means a new dashboard every day with a different challenge every time.
Today’s challenge was to webscrape some data about UFO sightings, so first we take it into Alteryx to download some data and using a lot of regex – parsing out the information that we want.
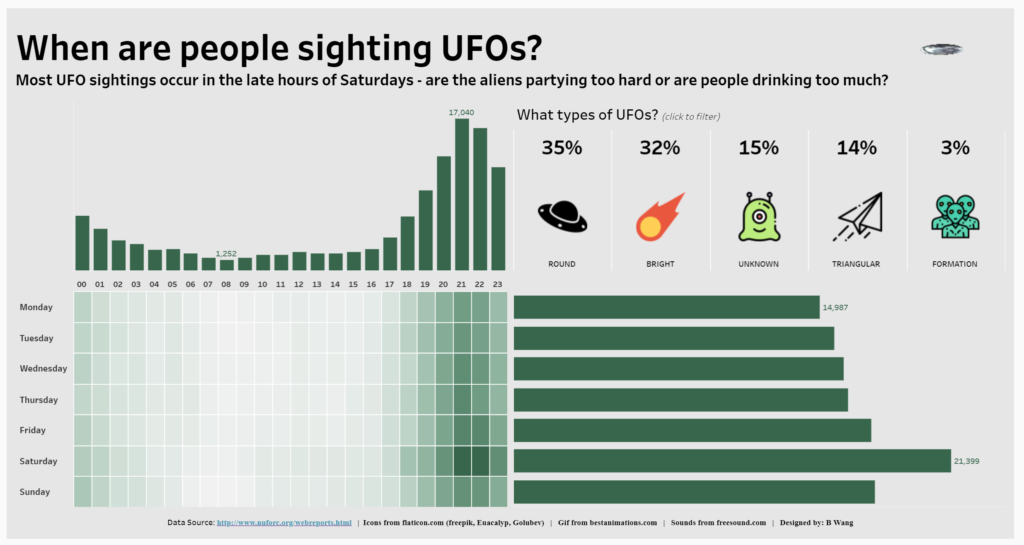
Here is the viz I came up with:
I wanted to experiment and add some new stuff that I’ve never done before as well. So I played around with some web objects in Tableau Public.
First I added in a gif. You can images, but they become static when you upload it. Instead I added a web object with the URL directed to the link to the gif.
Then I decided to have some fun with sounds. I looked for some royalty free mp3 files online and found a nice “alieny” background file. I then added this in as a web object and floated it off screen which auto plays when you load the viz!
All together, a fun start to dashboard week!