Moving Average is a widely used indicator in analysis that helps to smooth out the values by filtering out fluctuations. A Simple Moving Average is just the average of a measure over a period of time. MA is considered a trend-following indicator as it is based on past values.
This is how it works, for example, a 10 day moving average would average out the first 10 values of the data set as the first data point. The next data point would drop the earliest value, add the value of day 11 and take the average, and so on.
The length of the MA to use depends on the analysis objectives, with usually a shorter MAs used for short term objectives and longer MAs used for longer term objectives.
Let’s have a look at a practical example.
In this example I downloaded from Google Finance the historical share price data from a particular company from 12-08-2013 to 08-08-2016.
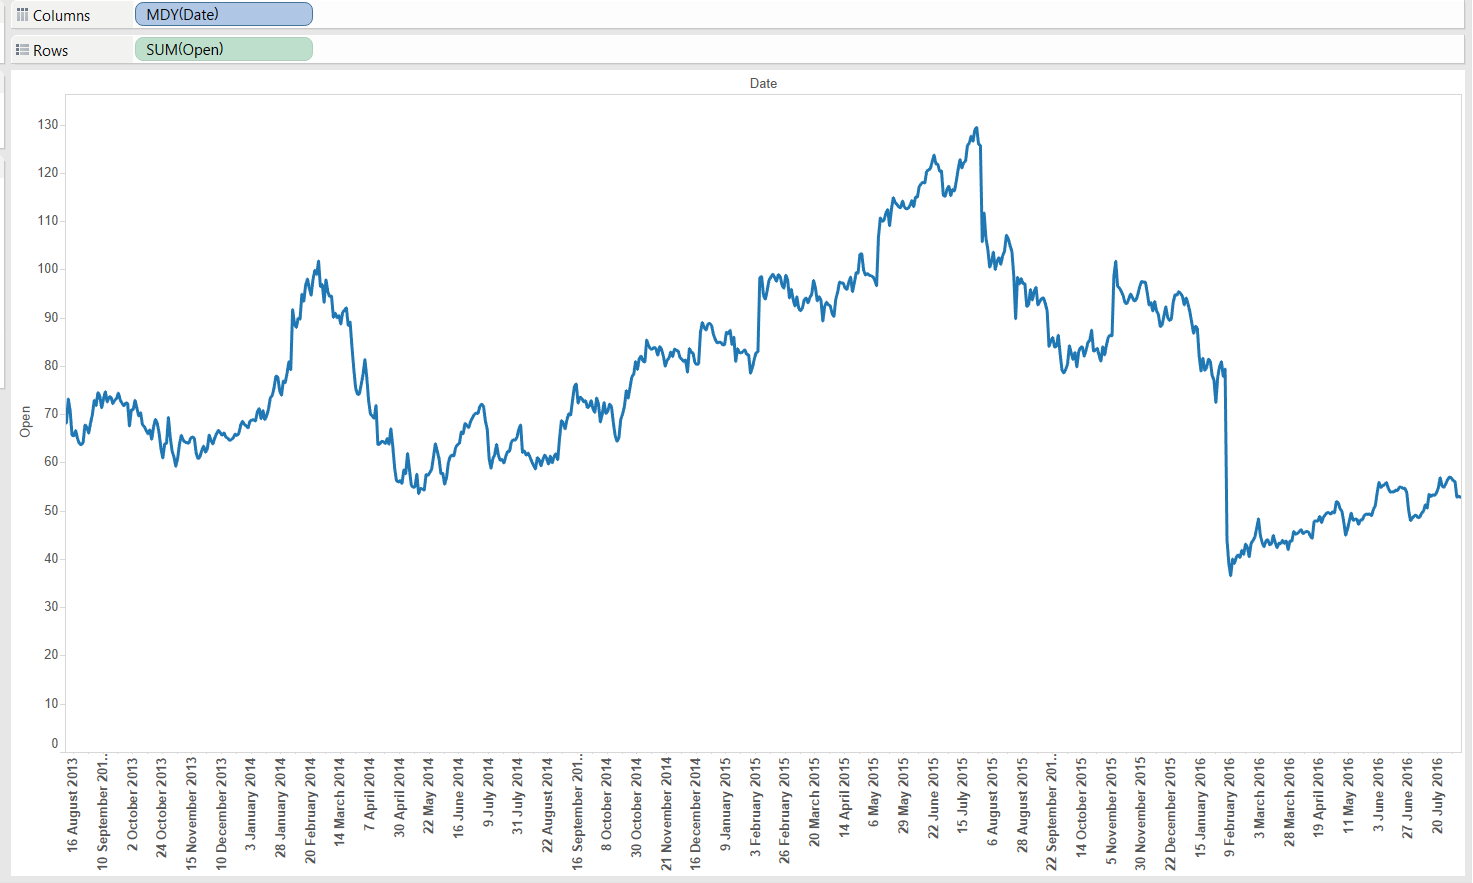
First of all, I’d like to look at the opening share prices per day therefore I drag the Date field to the columns.
Right click on Date, go to ‘More’ and select ‘Custom’.
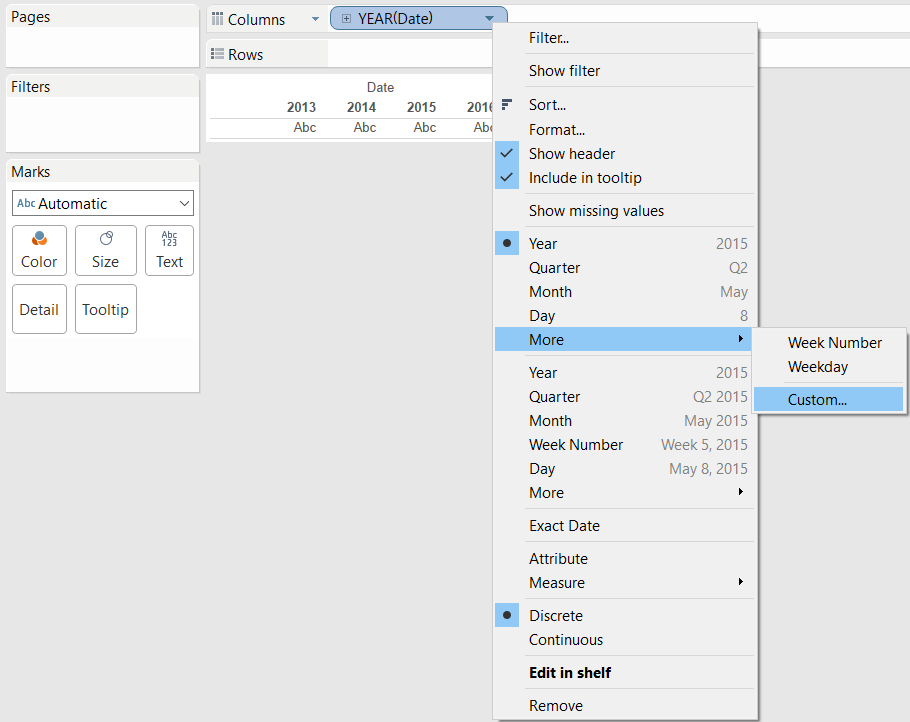
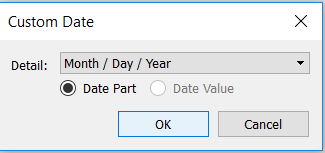
In the Custom Date window displayed now select the option Month/Day/Year, select Date Part, and click OK.
Select ‘Entire View’ to fit all the days in the view and drag the Open measure to the Rows shelf.
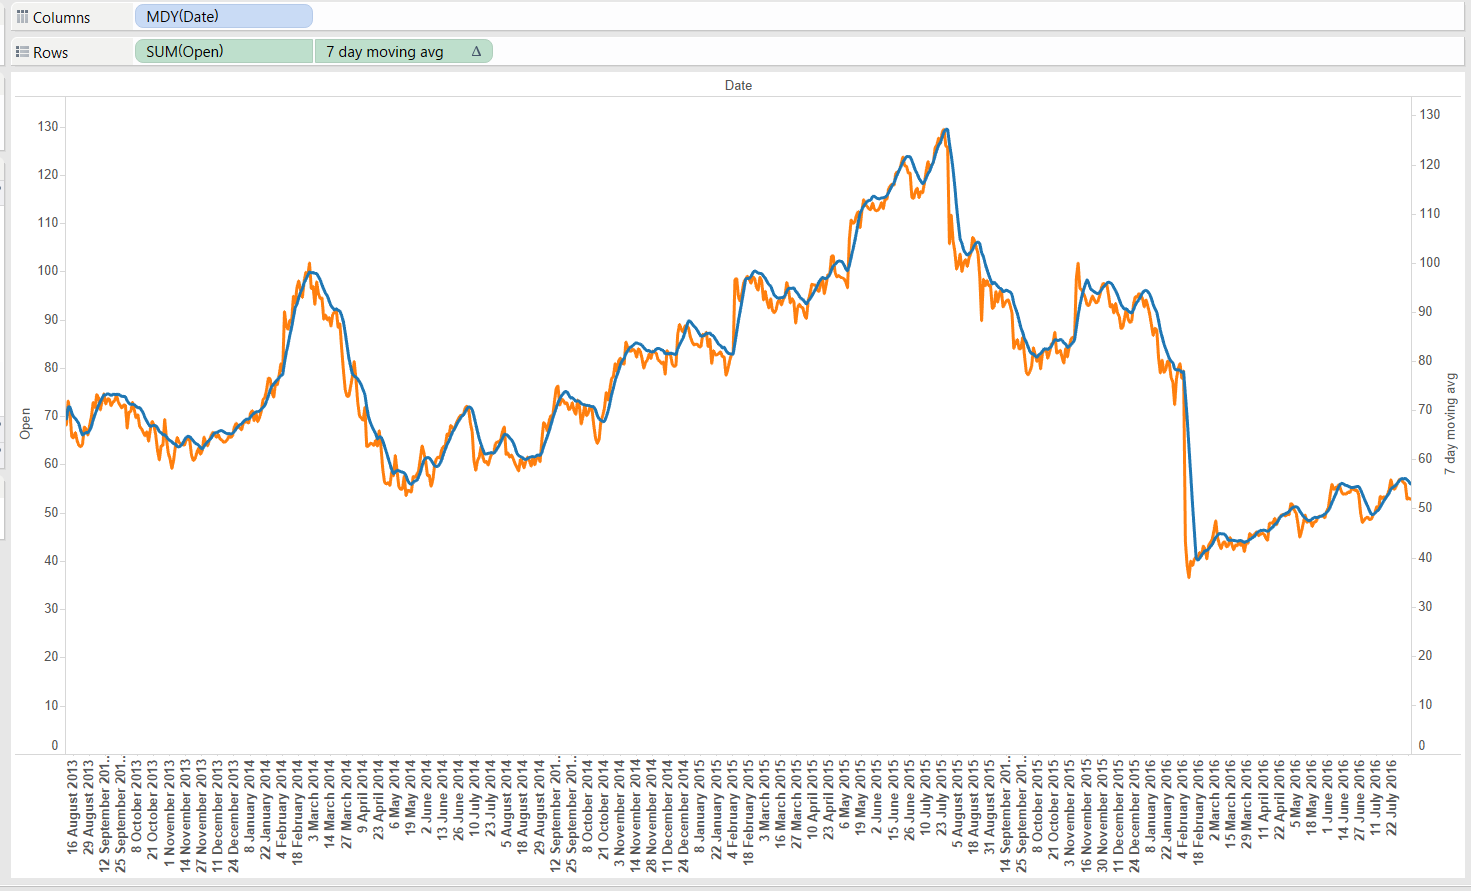
Now I’d like to be able to compare the opening share price against a 7 day moving average, how do I do that?
I started by dragging the ‘Open’ measure to the Rows shelf again. Right click in the second Open pill I dragged to the Rows shelf, select Add Table Calculation. In the Calculation Type section, I selected ‘Moving Calculation’, Summarize Values by ‘Average’, and then Previous Values (6), Next Values (0).
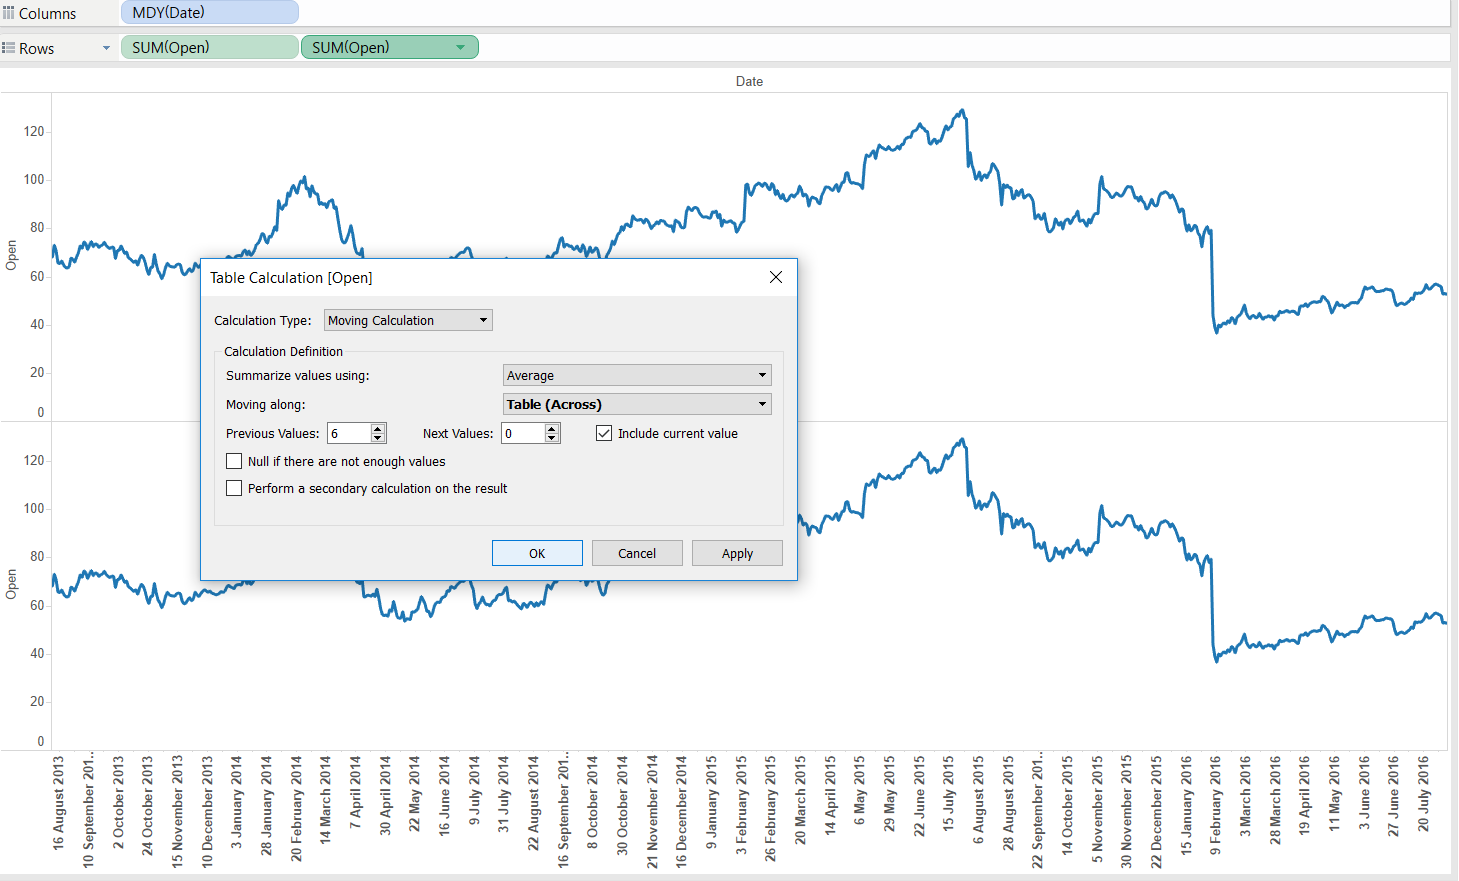
Note that the 7 day moving average includes the previous six days (6) and the current day (0).
Next step now is to click on Dual Axis in the second ‘Open’ pill, and Synchronize Axis.
I selected a different colour for my Moving Average line (I selected blue in this case) and I have my comparison between the actual share price per day and the 7 Day Moving Average.