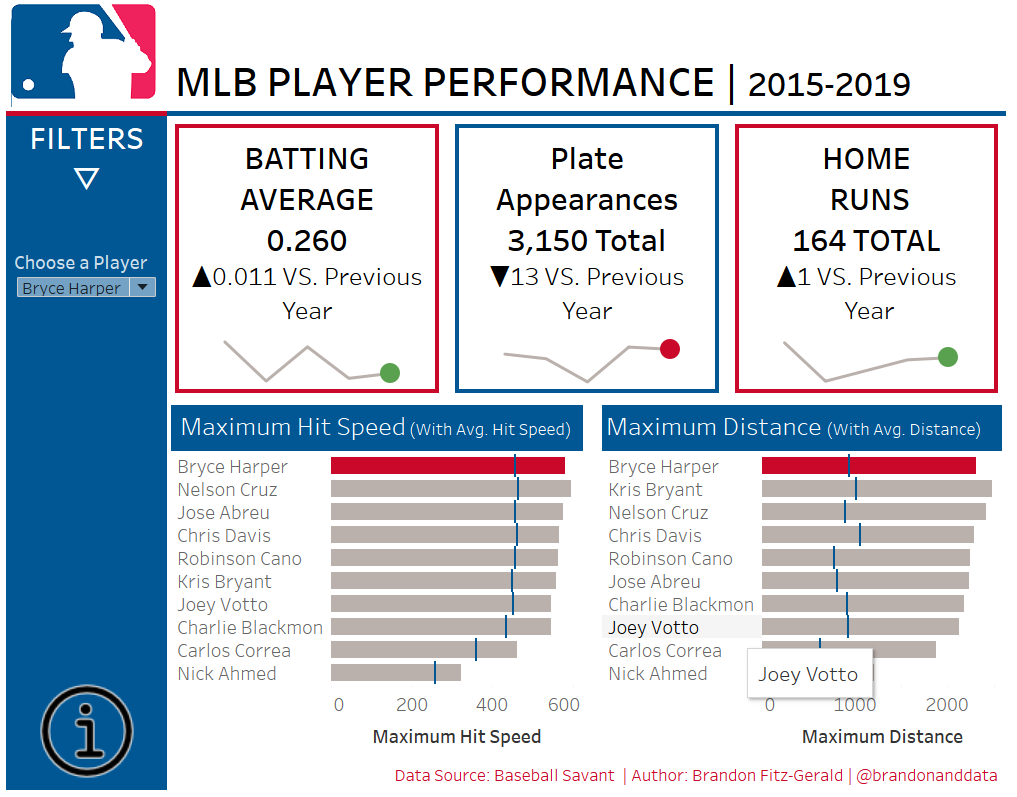
So dashboard week has come and gone for DS20, gone by a few weeks so this blog is a little bit late. (I’m sorry!) This series of five blogs will look at the dashboards that I created over the week and what I would improve upon each one now I’ve had some time to reflect. (Maybe I’ll write some update blogs later this week or next week when I’ve made those improvements?)
Day 1 – The Data
Using Baseball Savant we had to find some data about Player Performances to use in a KPI Style dashboard. I’ll be honest and admit that I know next to nothing about baseball, in fact before this dashboard my knowledge was little more than hit the ball and run. Because of this I opted for some of the measure that I felt most comfortable working with: Batting Average, Plate Appearances and Home Runs.
Day 1 – The Process
There’s only one real way I can describe my feelings throughout the day. STRESSED. And that’s probably an understatement. Any time I had made dashboards before, I had a lot longer than a few hours to do so. Coupled with my limited knowledge of the subject matter, I couldn’t see how I’d be able to produce a workable dashboard. But I did. That was one of the big takeaways for me from this week, I can achieve a lot more than I think.
Day 1 – The Results.

- The Positives!
- I like the colour scheme. Matching the colour scheme of major parts of the dashboard to that of the MLB logo (Seen in the top corner) made the dashboard feel a lot more cohesive than previous dashboards I’ve made.
- Likely due to the above point, coupled with complete planning of the dashboard: The dashboard looks clean!
- Context shown for the KPIs. It’s all well and good seeing an number, but a sparkline and numbers to show how it’s changed over time is even better, right?
- The Improvements!
- The instructions pop up (Bottom left corner) should have some kind of label to make it known that instructions are there.
- Is there a better way to show the lower to bar charts?
- What measure could be used instead?
- Is there a correlation between Maximum Hit Speed and Distance? This could be an area to look more into.
- Don’t limit the dataset to only 8 players!
Overall, I’m happy with the work that I produced. There’s definitely some work that needs to be done to improve the dashboard, but that’s what learning’s all about! Reaching for that next step and goal to make sure you improve. This mini challenge I’ve set myself to improve each of these dashboards I hope is a big step in my own personal development.
