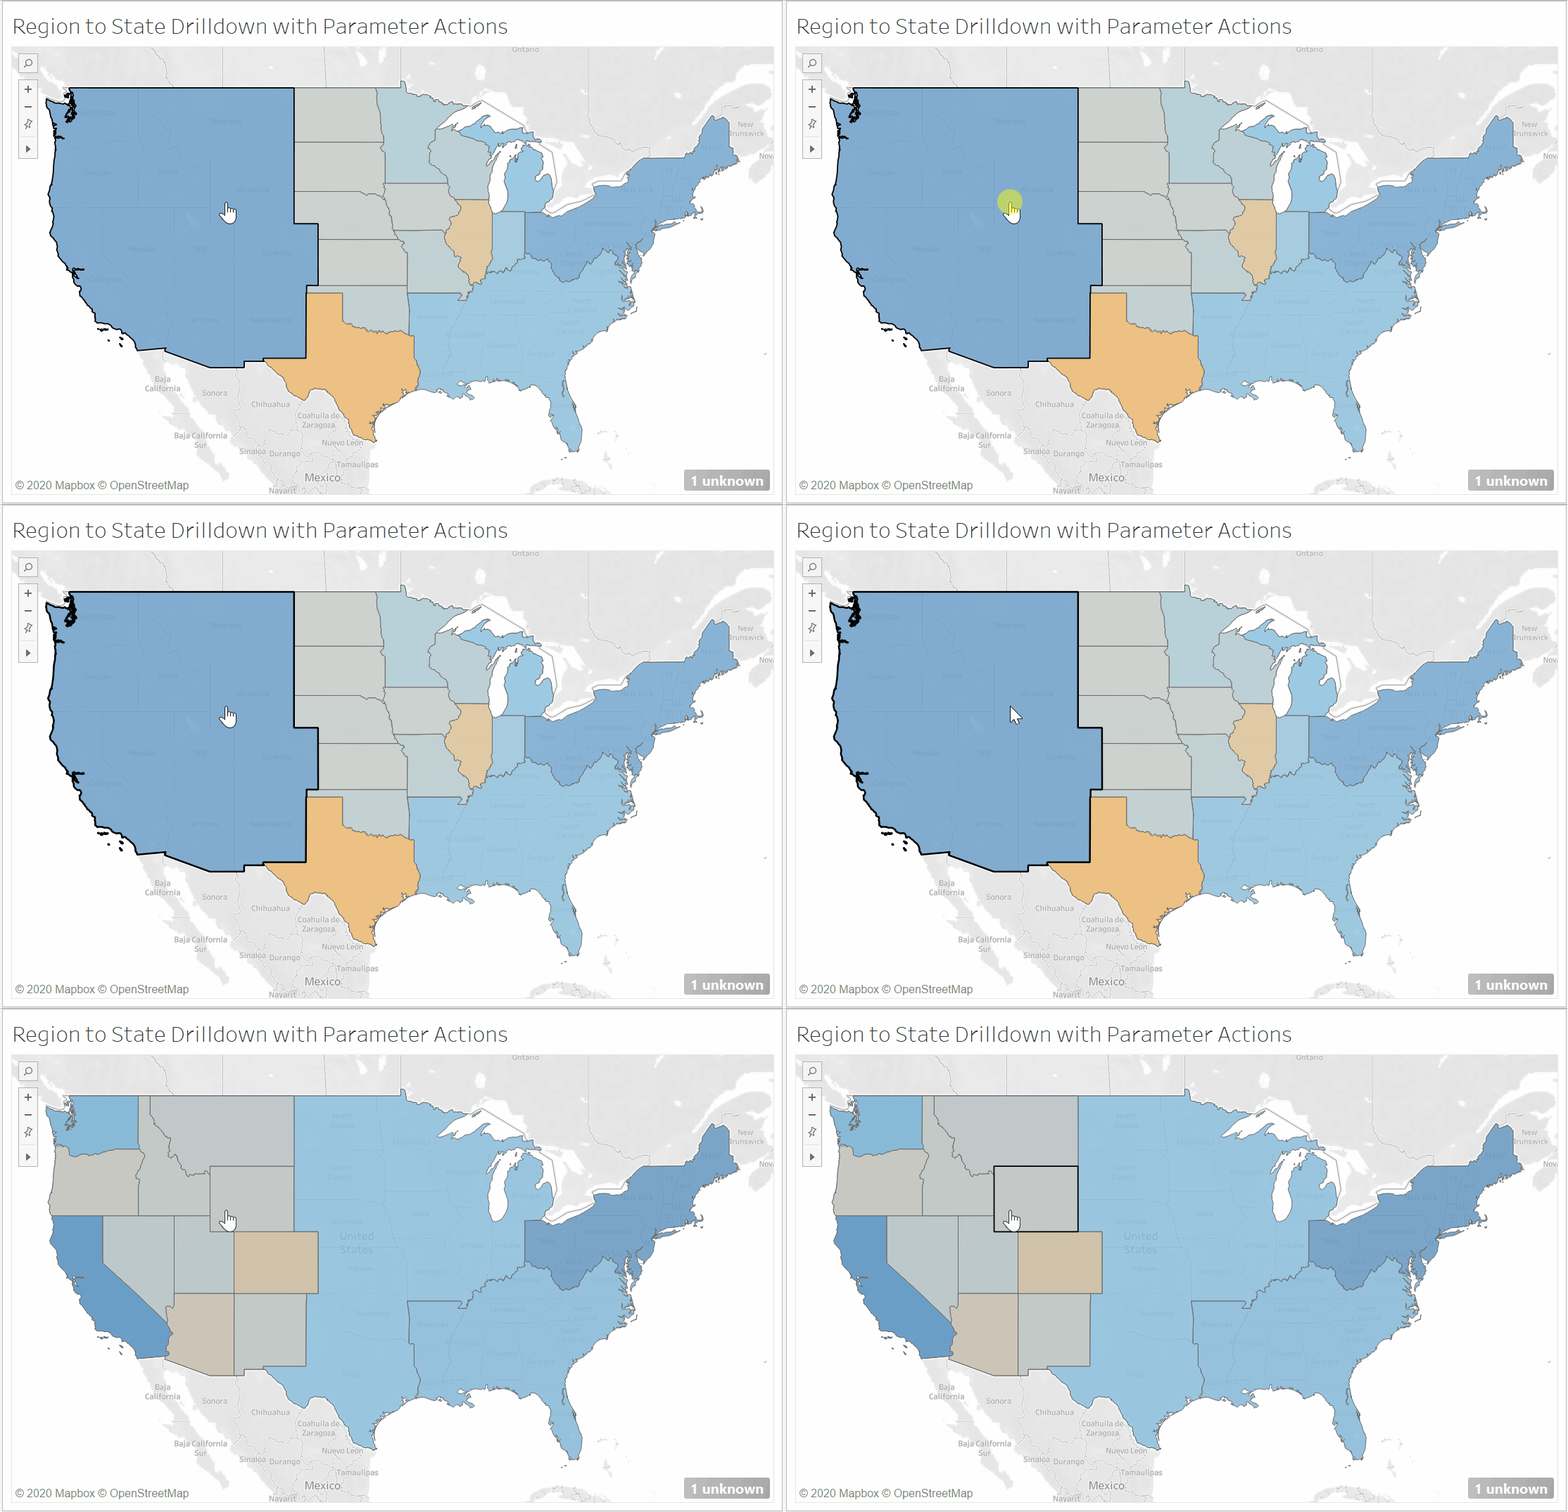
Using a drill down map can offer more detail about a specific location. I’ve used the Tableau Superstore data to create a map that will drill down from Regions to States, shown below.
Step 1|
Create a new parameter, I’ve called mine Region Parameter. Where prompted, make the data type a string, and set the current value to one of the regions in your dataset.

Step 2|
The next step is to create a calculated field. This calculated field will show the states within a specific region when that region has been selected.
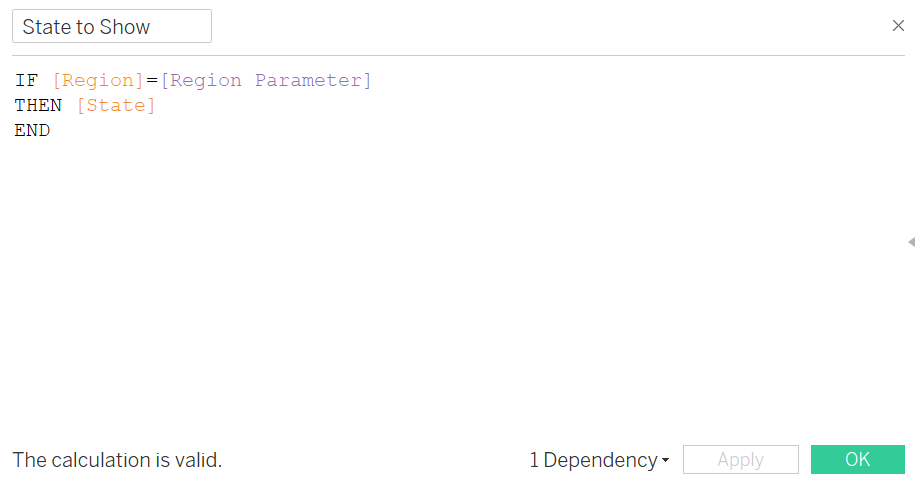
When the selected the value of ‘Region Parameter’ matches one of the Values for ‘Region’, the States within that Region will be shown.
Step 3|
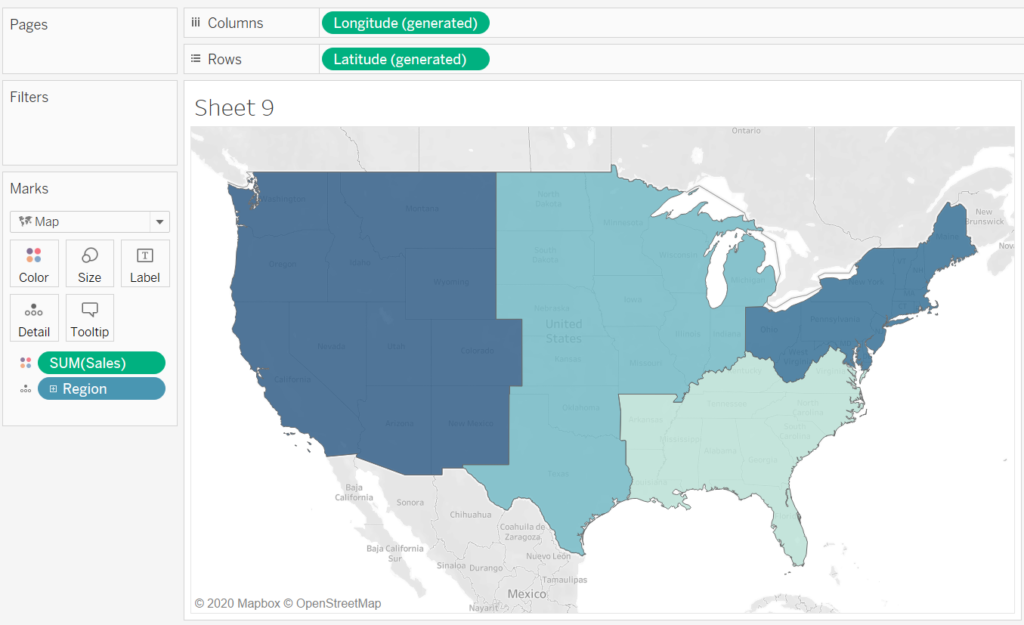
Create your filled map using Region. I’ve coloured mine by the Sum(Sales).
Step 4|
Duplicate the Latitude field, place this duplicated field on the Rows. (Ctrl + Left Click is a quick way to do this on windows).
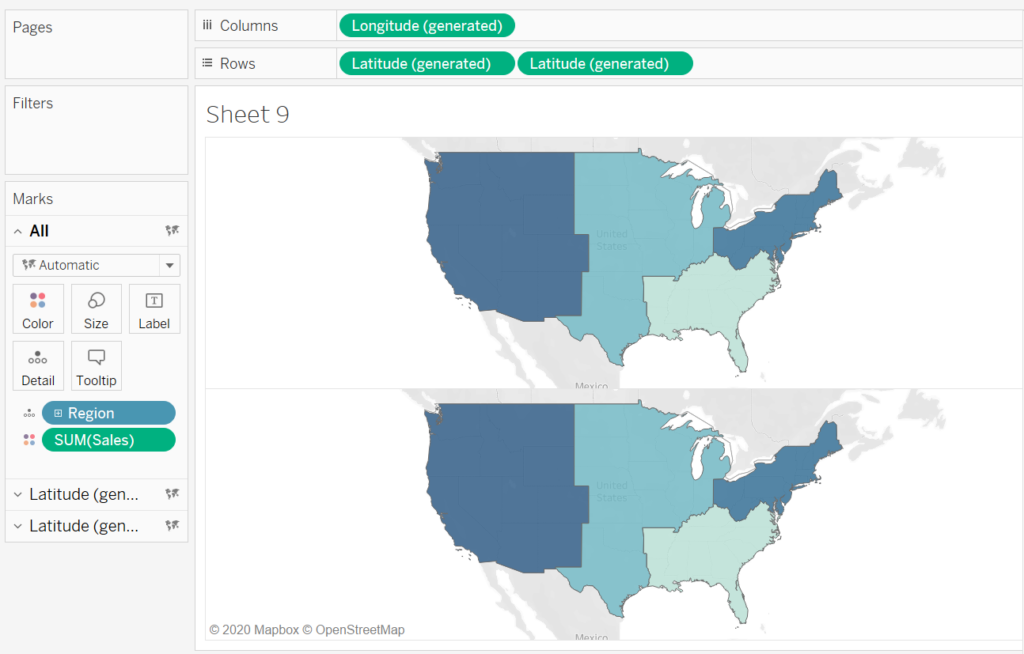
This duplicates the map, as seen in the figure above. We can set each map to show a different level of geography, one showing Region and one showing State, for example.
Step 5|
On your marks card, select the second of the Latitude drop downs. On the detail shelf, replace Region with the State to Show calculated field we created earlier. Once this has been done, dual axis the maps.
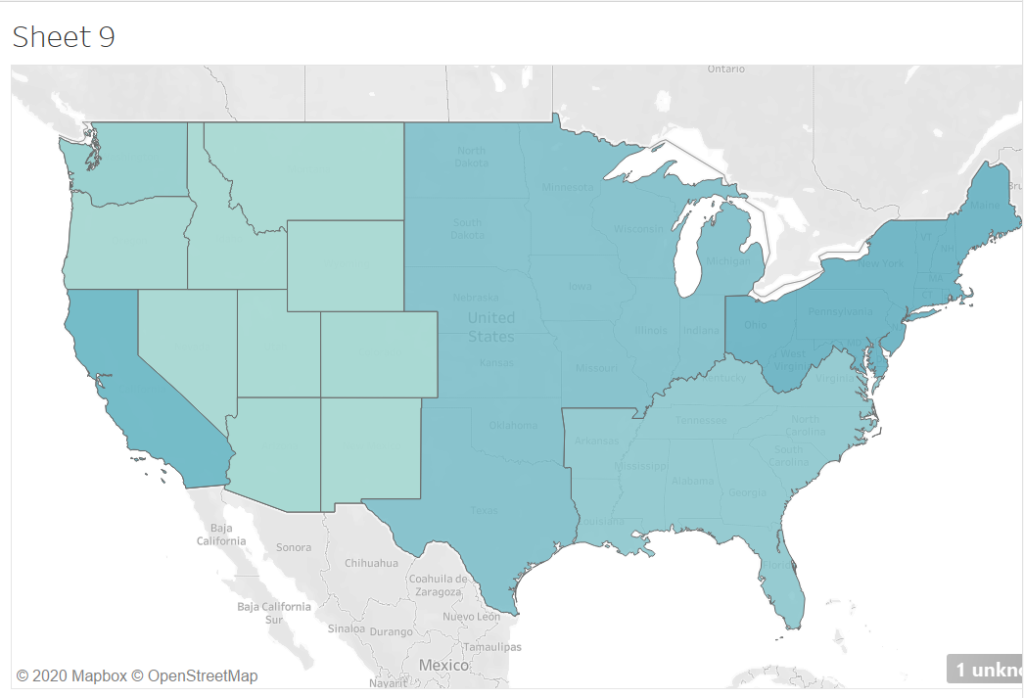
The states are shown in the selected region. However this drill down functionality is not yet applied to all regions. To do this, we will use a worksheet action.
Step 6|
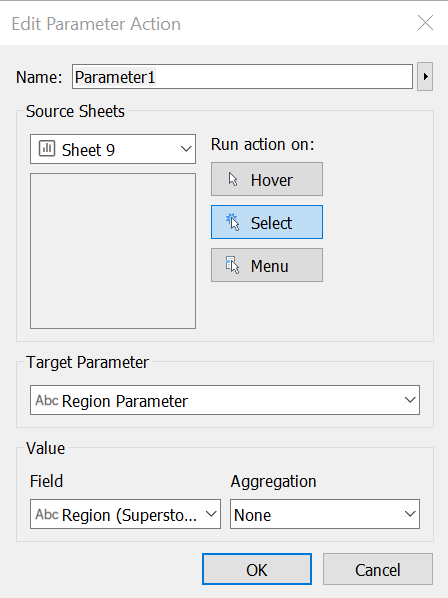
Create a new worksheet action. This worksheet action will be a ‘Change Parameter Action’. The source sheet should be the sheet in which you have created your map, the target parameter is your ‘region parameter’ and the field will be ‘Region’. As seen below.
And that is how to create a drilldown map using parameter actions. When you first select a region after following the above steps, there may be highlighting present. If you would like to get rid of this highlighting you can follow this tutorial.
