For this weeks client project at The Data School, one of my objectives was to group the clients customers based on the types of services that they were purchasing from the client. This is also known as customer segmentation. The business case for customer segmentation is straightforward enough – by identifying groups of customers that have similar purchasing habits, a business can target customers with an appropriately tailored marketing strategy. More generally, segmentation allows insight into patterns of interactivity between customers and their business.
One technique that can drive customer segmentation is cluster analysis. Clustering is a data-driven process for creating groups in a dataset that are defined by the relationships between a set of variables. Importantly, “cluster analysis” refers not just to a single method of analysis – several flavours of clustering algorithms exist, to meet the needs of different data types and applications.
A complete discussion of the advantages, disadvantages and applications of every clustering method is far beyond the scope of this blog post. In this post I’ll briefly describe the clustering methods that are available natively in Alteryx. After, I’ll discuss why these tools were unsuitable for my needs this week.
Clustering methods in Alteryx
The Alteryx Predictive Tools package contains a tool for doing cluster analysis called the K-Centroids Analysis Tool. This equips you with three clustering algorithms:
- K-means
- K-medians
- Neural Gas
K-means attempts to cluster a set of data points into a predefined number of clusters (k). The algorithm generates k random seed points, and assigns the observations (data points) to one of those seed points, depending on which are closest (by Euclidean distance). The algorithm then performs an iterative process – for each cluster, the average of the assigned data points is calculated, and the seed points are moved to this mean value. The data points are then reassigned to the newly placed cluster points. The algorithm will continue to iterate in this manor until there is no change in the placement of the seed points. The resulting cluster assignments are then outputted from the algorithm.
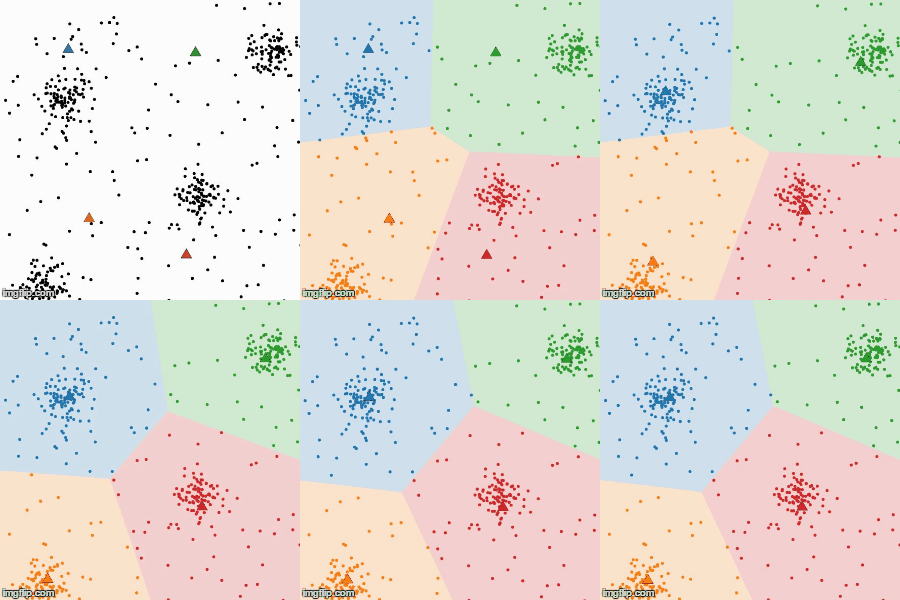
This gif illustrates how K-means is working (triangles are seed points).
K-medians operates in a similar way to K-means, but in an effort to reduce the influence of outlier data, calculates the median rather than the mean cluster value, and uses Manhattan rather than Euclidean distances.
Neural Gas is another extension of the K-means algorithm. The primary difference is, instead of each data point being assigned to a single cluster during the iterative process, every data point is assigned to EVERY cluster and given a weighted metric (assignment to closer clusters will have a higher weight than for clusters that are further away). One advantage of NG to K-means is that it is not biased by the placement of the random seed points during the initialisation process.
As you might have noticed, these algorithms have a lot in common:
- They are ‘hard clustering’ algorithms – every data point is exclusively assigned to one cluster.
- The number of clusters must be predefined by the analyst.
- Because means/medians are used for clustering, these algorithms are only appropriate for continuous data. Therefore, they are unsuitable for categorical data.
Why are some algorithms unsuitable for categorical data?
I’ll briefly expand on the last point – why are K-means, K-medians and NG not appropriate for clustering categorical data? Why can’t we just assign a number to each categorical level (this is known as Label Encoding), and stick it into the K Centroids tool?
Let’s take this silly fake dataset I made as an example:

Perhaps we want to cluster individuals (ID) based on their sex, which type of cola they prefer (drink), and their food choices (food). The Cola variable has three levels (coke, drpepper and pepsi). Because there is no natural ordinal relationship between these categories (i.e. coke is not greater than pepsi, nor is pepsi greater than the others), assigning a number to each categorical level would be meaningless. In addition, changing the order of the assigned numbers would yield different results in the clustering. So in the case of our drink variable, it would be entirely inappropriate to use K-means or one of it’s derivations listed above.
Let’s consider the food variable for a minute. We could impose an ordinal relationship between these categorical levels, in terms of, say, the range of animal products consumed. From lowest to highest, it would look something like this:
- vegan
- vegetarian
- pescatarian
- carivore
In this case, it could be considered appropriate to assign a number to these categorical levels, and analyse it using one of the algorithms mentioned above.
Clustering categorical data in Alteryx
The customer data that I was attempting to cluster last week was entirely categorical, and none of the variables possessed a natural ordinal relationship between the categorical levels. In terms of Alteryx Tools, I was pretty stuck for ideas. After doing some research, I came across the K-modes algorithm, which has an implementation in R (via the R package klaR). K-modes is another extension of the K-means algorithm, but for categorical data. In short, instead of calculating the mean of the data points within a cluster, the K-modes algorithm calculates (you guessed it..) the mode (the most common categorical level). It defines the distance between the seed points and data points as the number of mismatches between them. For a more thorough read on K-modes, see Jesse Johnson’s blog post.
Here’s a demonstration of how to implement K-modes in Alteryx. This example uses the same drink/food dataset above.
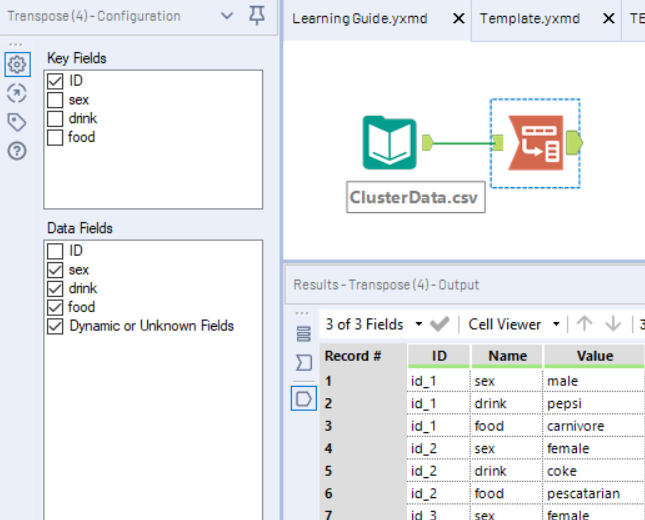
Firstly, I used the transpose tool to get a list of every categorical level from my three categorical variables (sex, drink, food), grouping by ID.
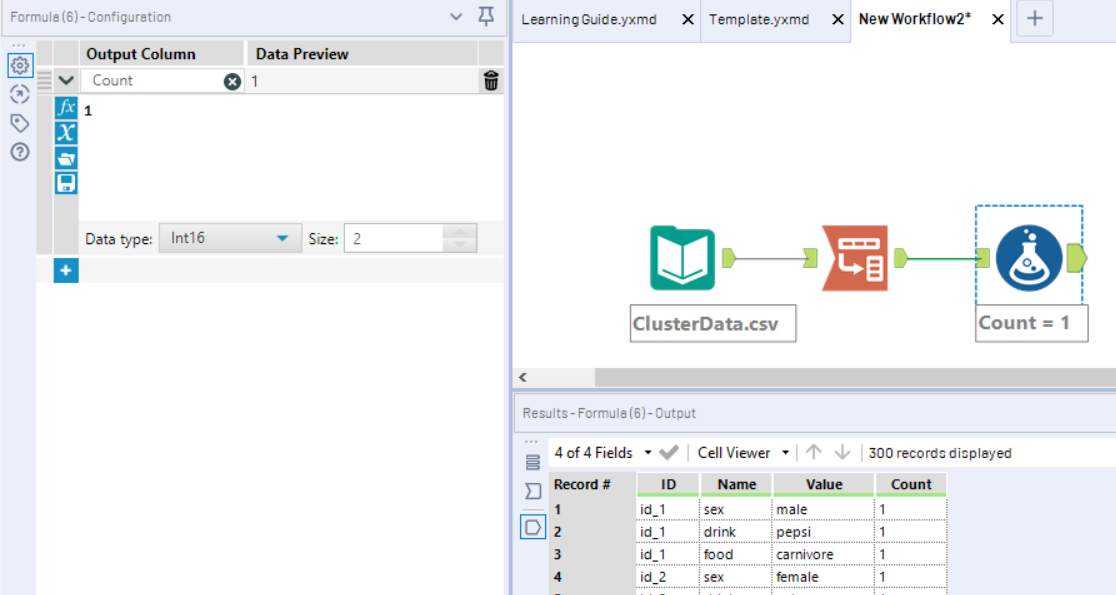
Next I created a new field “Count” using the formula tool. This should be an integer with a value of 1 for every row. This will be used to count the number of times a category level exists for a particular person.
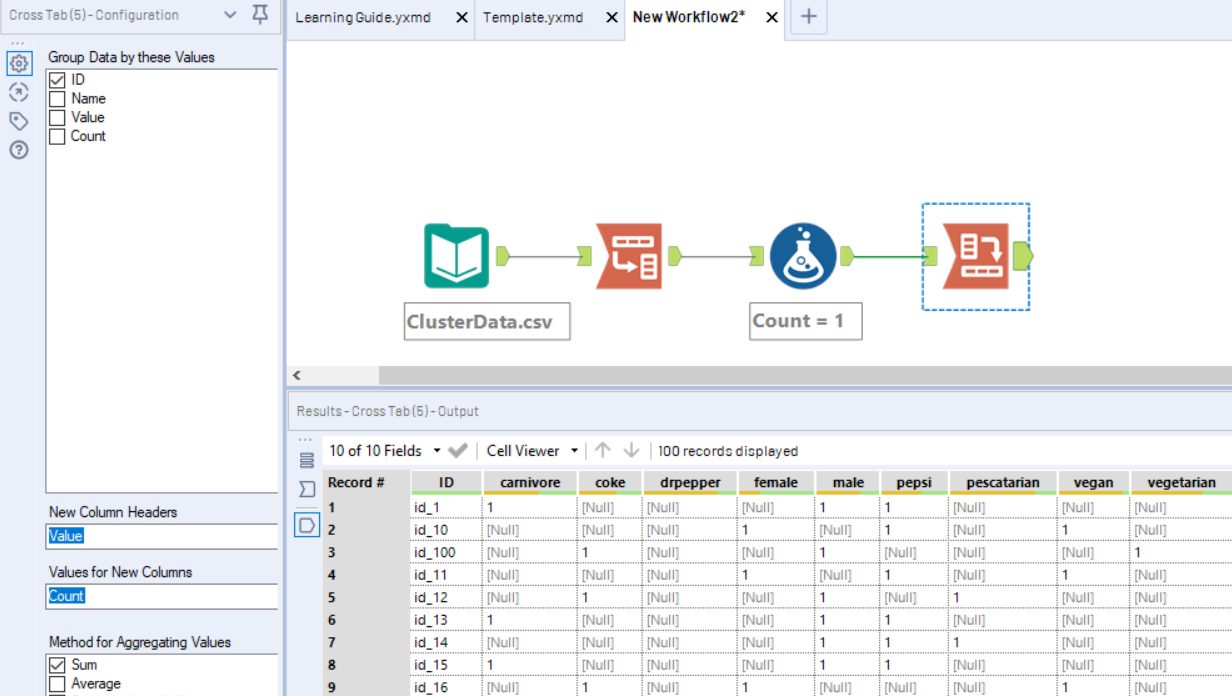
Now we use the Cross Tab tool to pivot the Value field, so that each categorical level has its own column. The values for these new fields will be the sum of the “Count” field, which will equal the number of times a particular person was associated with that categorical level.
Next I used the data cleansing tool to replace Nulls with 0’s.
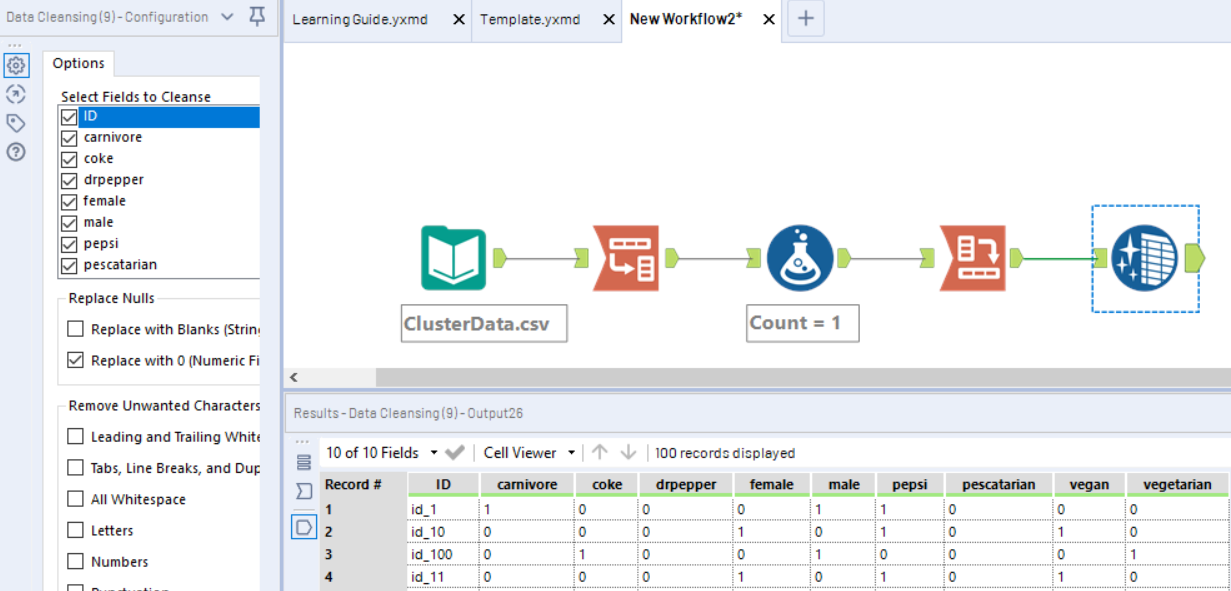
This is essentially how the data needs to look before K-modes can be performed. You might know this treatment of categorical variables as “dummy coding” or “one hot encoding”, depending on what your background is. On a side note, if you are feeding categorical variables into predictive models, they should look something like this, and not be label encoded (read more here).
Now to generate the clusters. I used the Alteryx R Tool, and the klaR package. To install the package on your machine for Alteryx, you can use the Install R Packages App. K-modes is run using the function kmodes, which takes arguments for the dummy coded dataset (minus the ID field), the desired number of clusters (in this example I’ve set it to 5), and the maximum number of iterations you will allow the algorithm to perform.
The code for the R Tool is as follows:
library(klaR) # Load klaR package

data = read.Alteryx("#1", mode="data.frame") # read data from connection 1

kmod = kmodes(data[,2:length(data)], 5, iter.max = 50) # Perform K-modes on the data, columns 2:end. Extract 5 clusters.

data$cluster = kmod$cluster # Assign the cluster labels back to the original dataset

write.Alteryx(data, 1) # Pass data through R Tool output 1
This will return our dataset with the cluster labels in a new field called “clusters”. Lastly, we want to join those cluster labels back to the original dataset, so we don’t have to continue working with dummy coded data. This is done with a Join Tool, joining on the ID field.
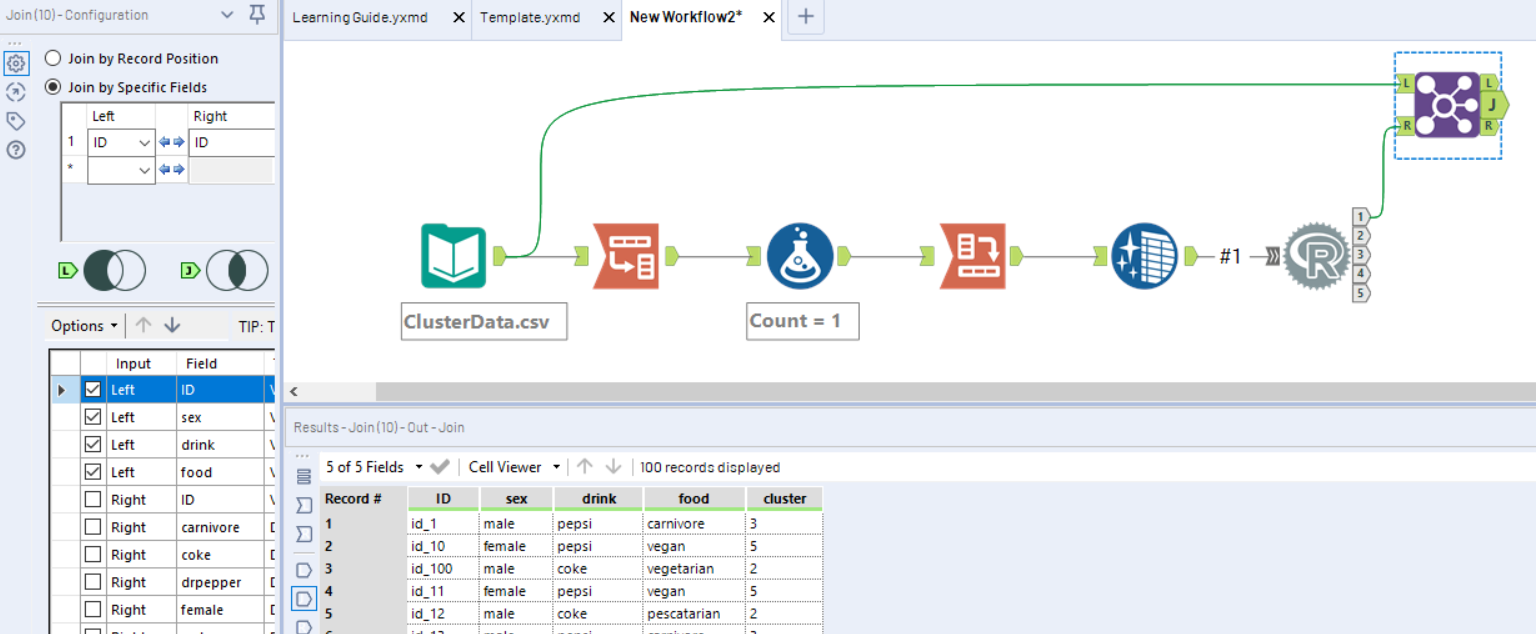
Now, each of our individuals/clients is assigned to a cluster. The next step would be to visualise these clusters to see if you can interpret them and pull out some insight. But that is a task for another day, and considering how lengthy this post is getting, I think I’d better leave it here!
