For Dashboard Week day 1, Andy asked us to use the Star Wars API to download data. The API allows you to obtain data about various aspects of the Star Wars universe, such as characters, vehicles, planets and species. I went with characters. Here’s what I came up with in the end:

While the API gave me the details you can see beside the character image (gender, species, homeworld, etc.), it’s not much information to visualise. What I really wanted was some information about the relationships between the characters. Initially I downloaded the script of Episode 1 – The Phantom Menace, and using Alteryx managed to squeeze out the number of times two characters appeared in a scene together. When I got to Episode 2, I realised I had wasted my time. The only version of the script I could find was in a totally different format to the first film. I quickly decided that adapting a workflow for more than one (potentially seven) films wasn’t worth the time it would take, and abandoned the idea of extracting that information myself.
Luckily, there are other people out there that have much more time than the couple of hours I had today to parse character names from movie scripts. I found this project by Evelina Gabasova, who had extracted the number of scenes in which two given Star Wars characters spoke to each other throughout the movie franchise – fantastic.
I spent some time making a lookup file to join her dataset with the data I had taken from the API – the character names appear differently in the scripts (e.g. “C3P0” = “THREEPIO”).
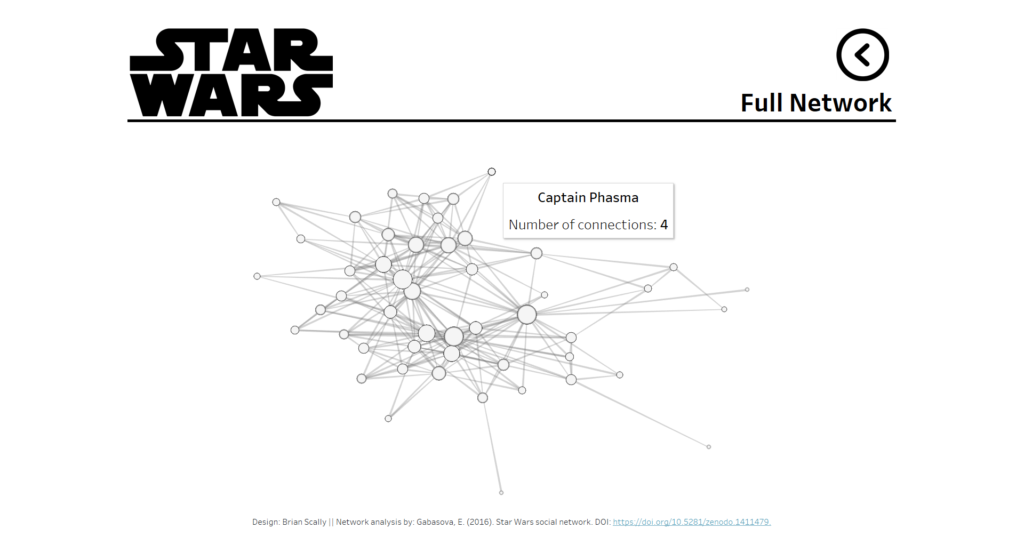
I figured visualising the relationships in a network diagram would be fun, and sized the nodes by the degree (number of connections) of each character. I used Ben Moss’s Plot Network tool in Alteryx to structure a network and extract the coordinates of the nodes. He has excellent documentation, and an example on Tableau Public that you can dissemble if you want to learn what pill to put where in Tableau.

Another error I made was using a Tableau Extension to show the images on the dashboard. I totally forgot that the extensions don’t work on Tableau Public. So I had to download all of the images (I batched them in Alteryx, don’t worry) and assign them to shapes in Tableau, which was a bit of a pain.
Overall I’m happy enough with how the dashboard looks. Unfortunately the characters that were included in the connectivity project didn’t fully extend to the number of characters in the API data, so I am under representing the extent of the SW universe, no doubt.
Tomorrow, I hope it’s a dataset with more numbers.
