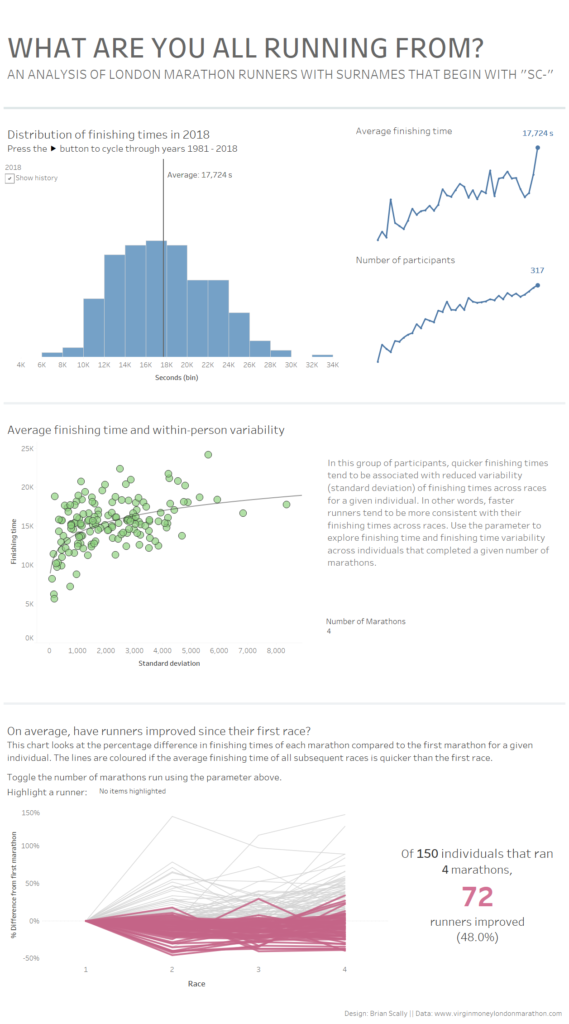
This morning, Andy directed us to https://www.virginmoneylondonmarathon.com, and told us to scrape every London Marathon result from 1981-2018, for information about individuals that shared the first two letters of our surnames. Weird enough task.
The Alteryx workflow was simple enough in terms of the actual web scraping element. However, there were a few issues with the data that we couldn’t resolve. Firstly, there were multiple people with the same name racing in a given year, and across years. Because there was no unique identifier, I couldn’t link the same person across years, or distinguish between two people with a given name within a year. The approach I decided to take was to remove anybody from the data who was flagged as having a duplicate entry in a given year. For the sake of the exercise, if one name appeared just once per annum across multiple years, I made the assumption that they were the same person.
I split my dashboard into three sections:
- Analysis of the distribution of finishing times from 1981-2018
- The relationship between the stability of finishing times across races (standard deviation) and actual finishing times.
- Did people improve after their first marathon (if they ran in more than one year).
The outcome is below. I think we all wish we could have had the full dataset, and a unique identifier per individual to avoid making risky assumptions and to be able to generalise about our conclusions, since the only option was to make a fairly analytical dashboard. Otherwise it was a pretty enjoyable dataset to work with!
The link to the Tableau Public version is here. Unfortunately if you want to play with the pages function you’ll have to download the workbook. Someday, Tableau Public, someday.

