So you’ve just made your first population pyramid in Tableau. Here’s one I quickly put together, showing the distribution of males and females in Japan across a range of age bins:
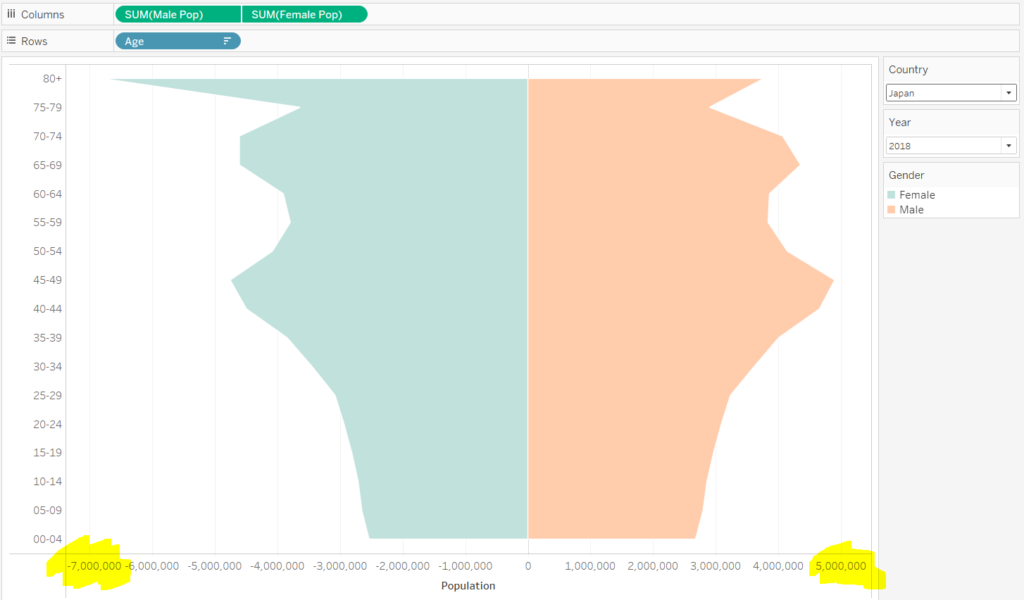
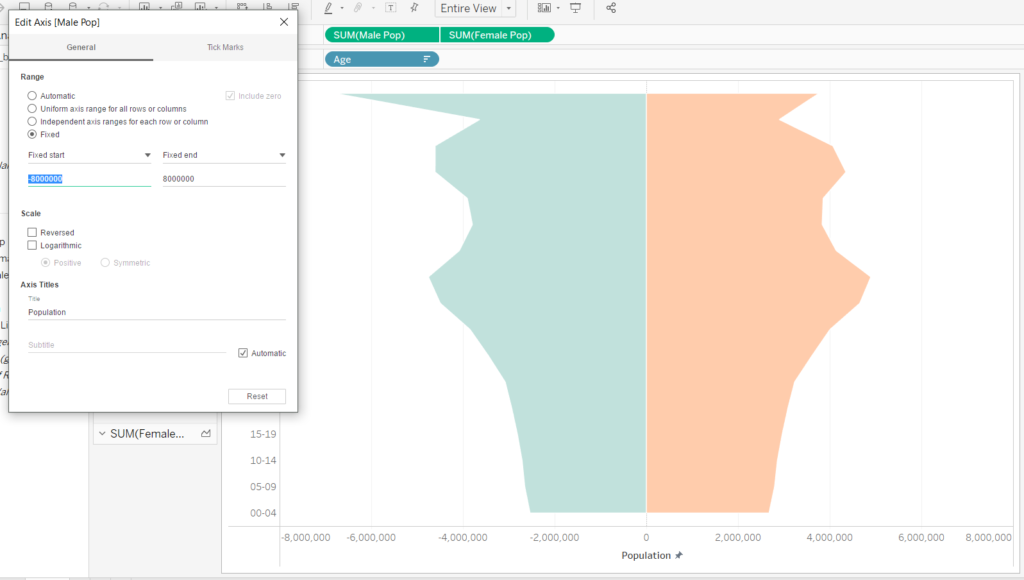
But look, the x-axis is all wrong – it extends to around 7,000,000 for females, but only to 5,000,000 for males. We could fix the axis to extend to 8 million on both sides, which would fix the problem.
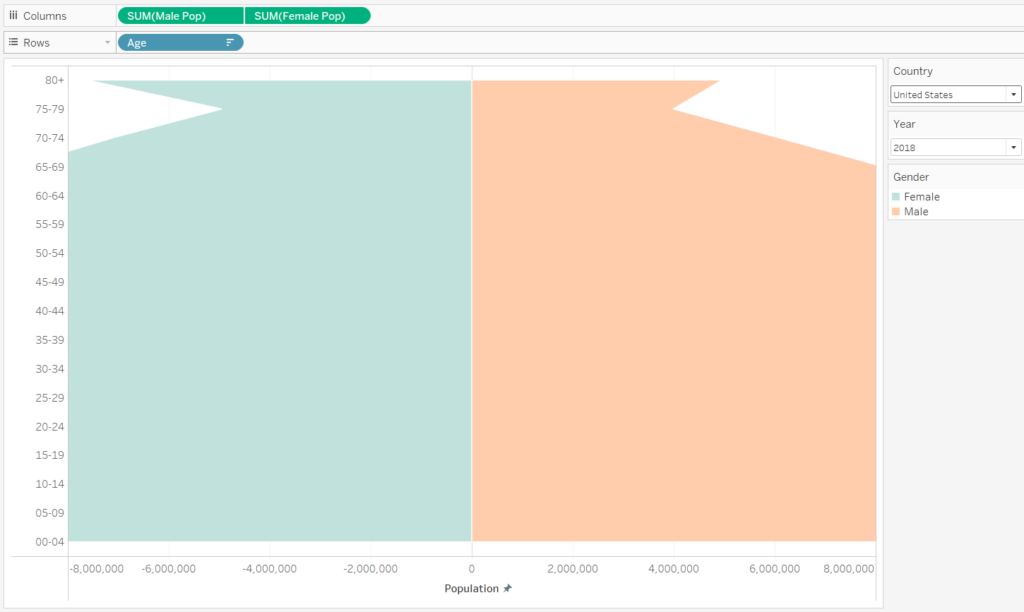
However, when I filter by a different country with a smaller or larger population than Japan (e.g. the United States) we’re in trouble with our axis again.
One way to appropriately adapt the axis to the population limits of any given country is to use reference lines. Going back to our Japan example, we can use the WINDOW functions to find the most extreme value for males:
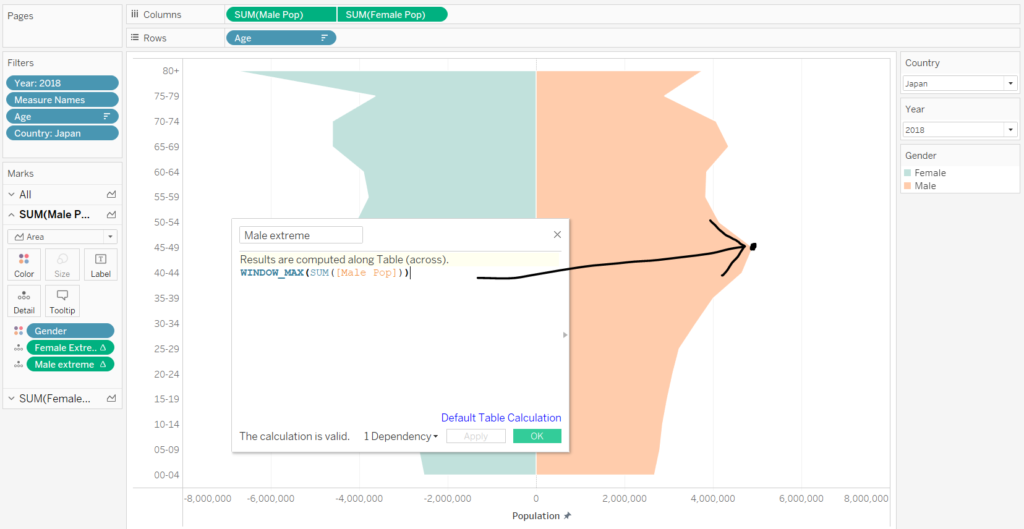
…and females:
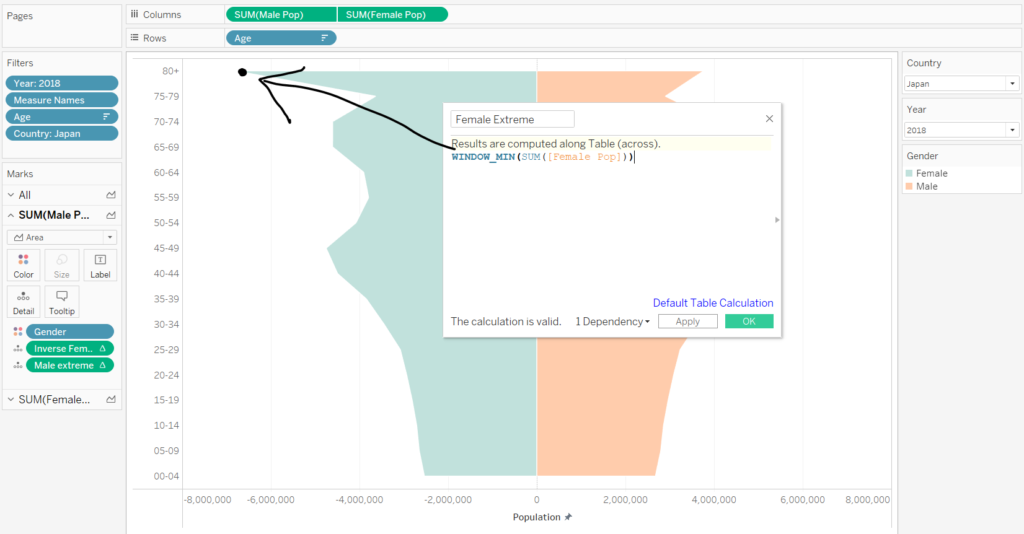
I’ll briefly recap on the WINDOW functions. The WINDOW functions allow you to perform calculations on measures that are in the view, such as MIN, MAX, AVG and SUM. By using WINDOW_MIN on the negative-going measure (female population) and WINDOW_MAX on the positive-going measure (male population) we can index the extreme values on either side.
Now, back to the population pyramid axis. If we can pick out the most extreme positive and negative values in the pyramid, we can plot reference lines on the chart at those values like so:
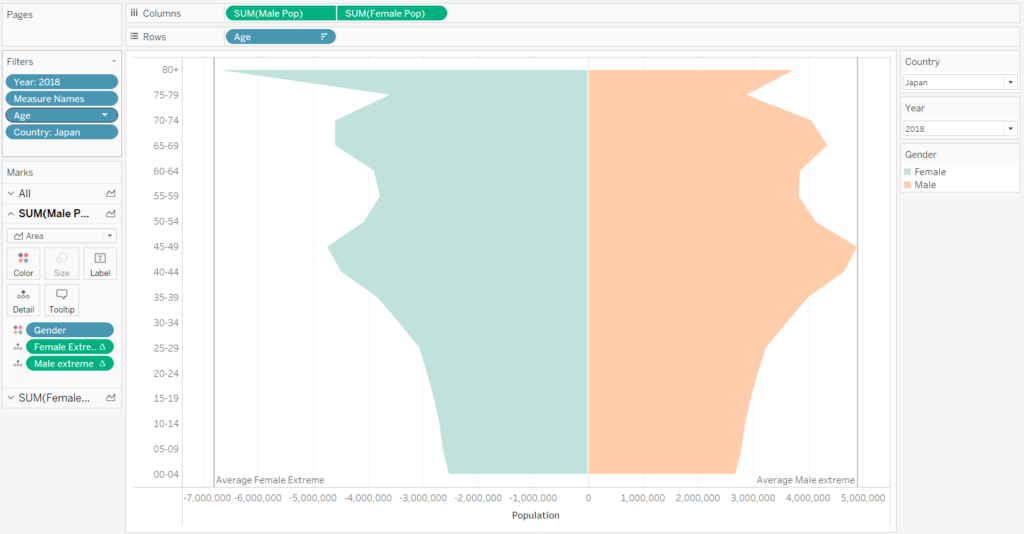
Not much good at the moment. But here’s the trick – if we invert those values (multiply them by -1), the axis will adapt to accommodate those values on each side of the chart. Open the calculations for Female Extreme and Male Extreme, and multiply them by -1. The axis is now right where we want it.
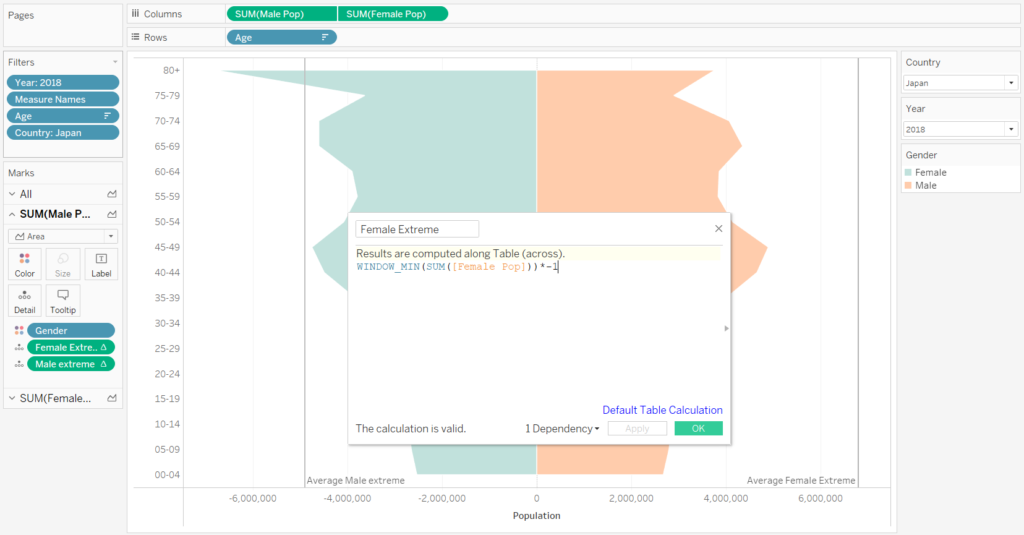
All that’s left is a bit of formatting to make the reference lines invisible. Click on a reference line, Edit, and you can do the formatting from there. As a result, when you filter to different countries, the axis is symmetrical for both sides of the pyramid and adapts to the population limits of each country!

