


APIs allow us to fetch data from an external source. They're helpful for organizations looking to centralize data processing, control traffic flow, and implement authentication protocols. Because an API sits between applications and the backend, it can monitor incoming requests and prevent system overload.
Traditionally, building and working with APIs has required Python knowledge. With Alteryx, however, we can work code-free with an API, making data integrations very accessible.
I recently used an API from the UK's Police Department to fetch data about all crimes occurring around The Information Lab's London office. I used this link to find the instructions for setting up the API:
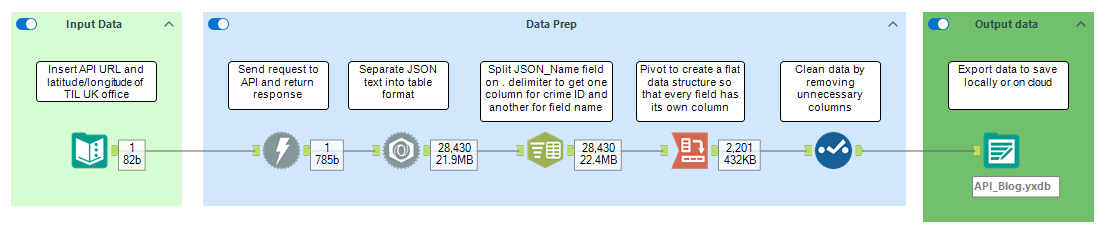
In this blog, I'll walk through each step of my workflow by explaining what I did and why it was necessary. Here's the final flow with all tools used: Text Input, Download, JSON Parse, Text to Columns, Cross Tab, Select, and Output.
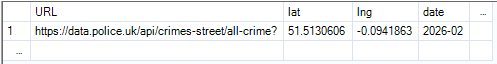
- I first identified the structure of the API URL in the link above and added this to the first row of my table using the Text Input tool. Because I need to provide the API with longitude and latitude in order for it to give me crimes occurring in a certain area, I entered the coordinates of The Information Lab's London office. For this exercise, I was just interested in viewing data from the most recent month, so my rightmost field became 'date.'
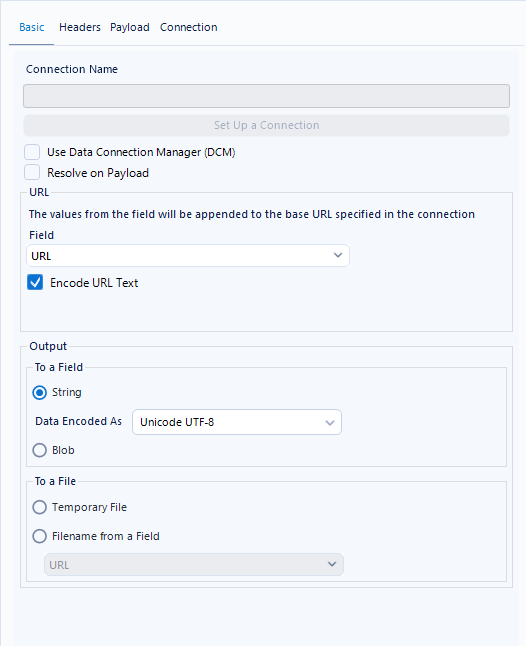
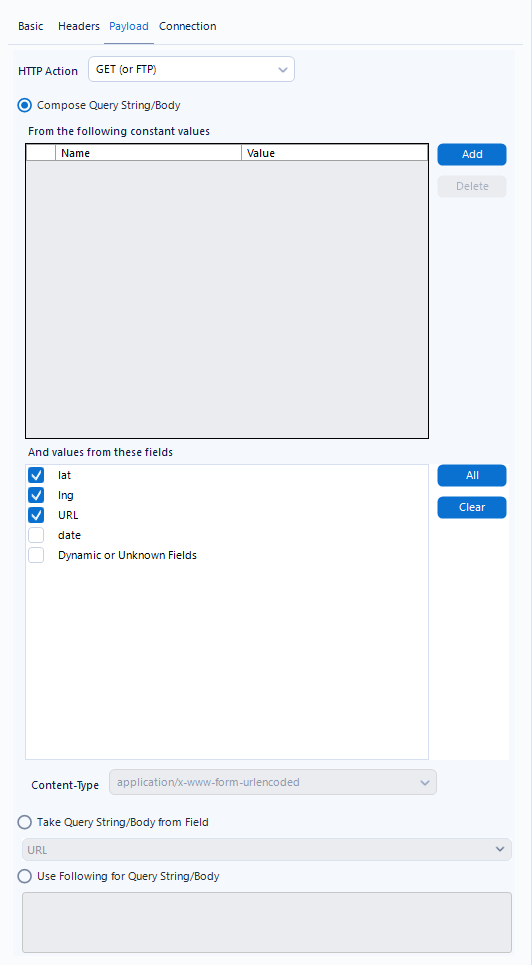
- In the Download tool, I configured the Basic and Payload tab to create a unique URL that the API could use to fetch the data. In the Basic tab, I indicated the field where my URL can be found, and in the Payload tab, I selected the fields that should be included in the URL. This will allow the ultimate URL to be specific to the coordinates I've provided.
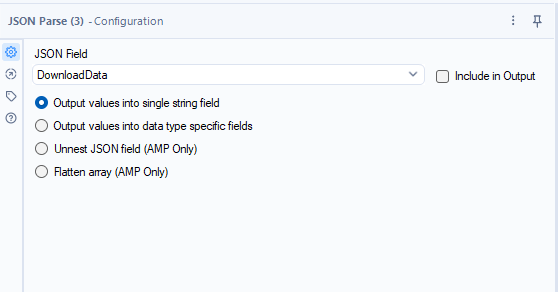
- At this stage, when I ran the workflow I was given a new field: DownloadData. This field contains all the data that was pulled with the API, so now I need to bring this data into a readable format. Using the JSON Parse tool, I selected the DownloadData field to bring the values into a table format. The image below is my output, where my main fields of interest are JSON_Name and JSON_ValueString. These are the two fields containing information about each crime. You can see this JSON_Name, which contains "category" and "location_type," among other fields.
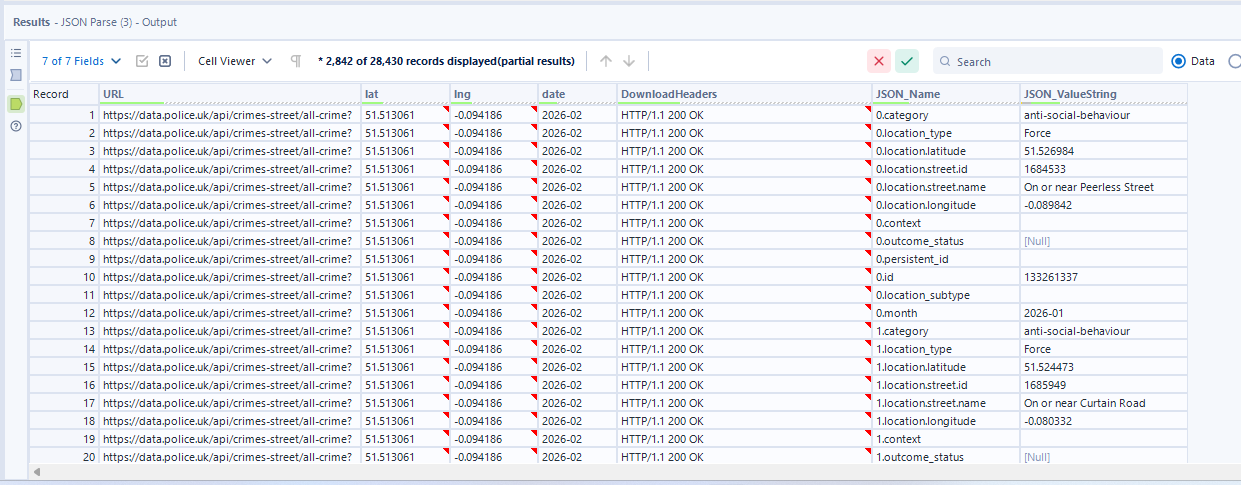
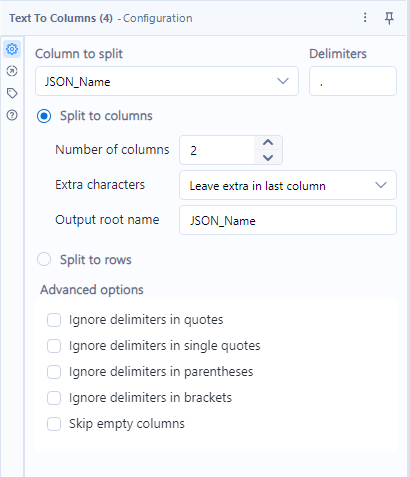
- Not only does JSON_Name contain fields with information about each crime, but each cell starts with a number, which is the ID of the crime. We can see this as each consecutive number begins at "category." In order to separate the crime ID from the field (e.g., "category), we need to use the Text to Columns tool to separate on the period.
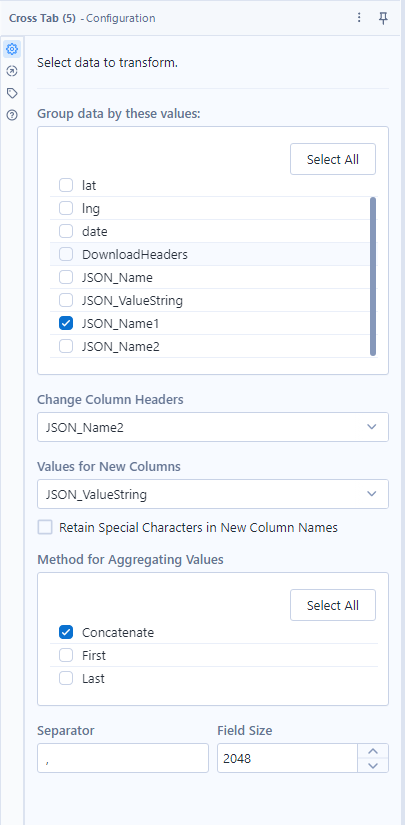
- Now we have a separate column for ID and field, but we don't yet have a data format that is usable for data analysis. For that, we want each row of data to represent one unique ID. That dataset will be wider and shorter than what we have now, which is thin and long. Instead of having multiple rows with data about crime ID 0, we want just one row with all the data about crime ID 0, running from left to right. To do that, we'll pull in the Cross Tab tool to pivot from rows to columns.
- We're going to group by JSON_Name1 as that contains our crime ID, and we want to keep data about each individual crime ID in the same row. Our header (or column) values will come from JSON_Name2. The values for these new columns – what will populate the rows – will be pulled from JSON_ValueString.
- We're going to group by JSON_Name1 as that contains our crime ID, and we want to keep data about each individual crime ID in the same row. Our header (or column) values will come from JSON_Name2. The values for these new columns – what will populate the rows – will be pulled from JSON_ValueString.
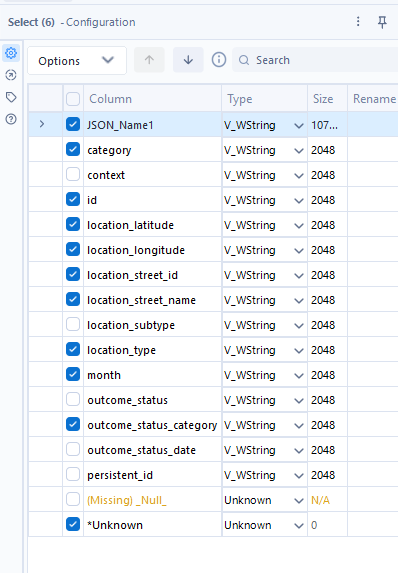
- Finally, we can use the Select tool to remove any unnecessary columns that we don't need for analysis.
- To round this out, the Output tool allows us to export the table for use elsewhere!