


Today is the last day of our Dashboard Week, and our task is to download the data for all bike counter locations in Seattle. Use Alteryx or Tableau Prep for data preparation. Then create a dashboard on Tableau.
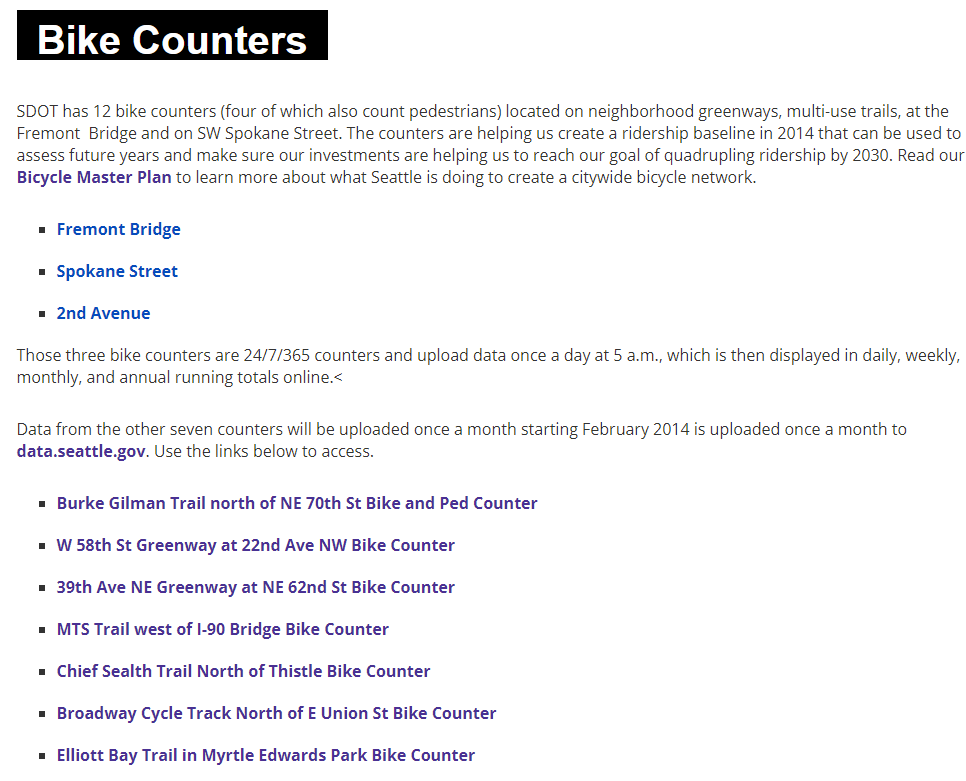
Link we need to gather data from: http://www.seattle.gov/transportation/projects-and-programs/programs/bike-program/bike-counters
Step 1
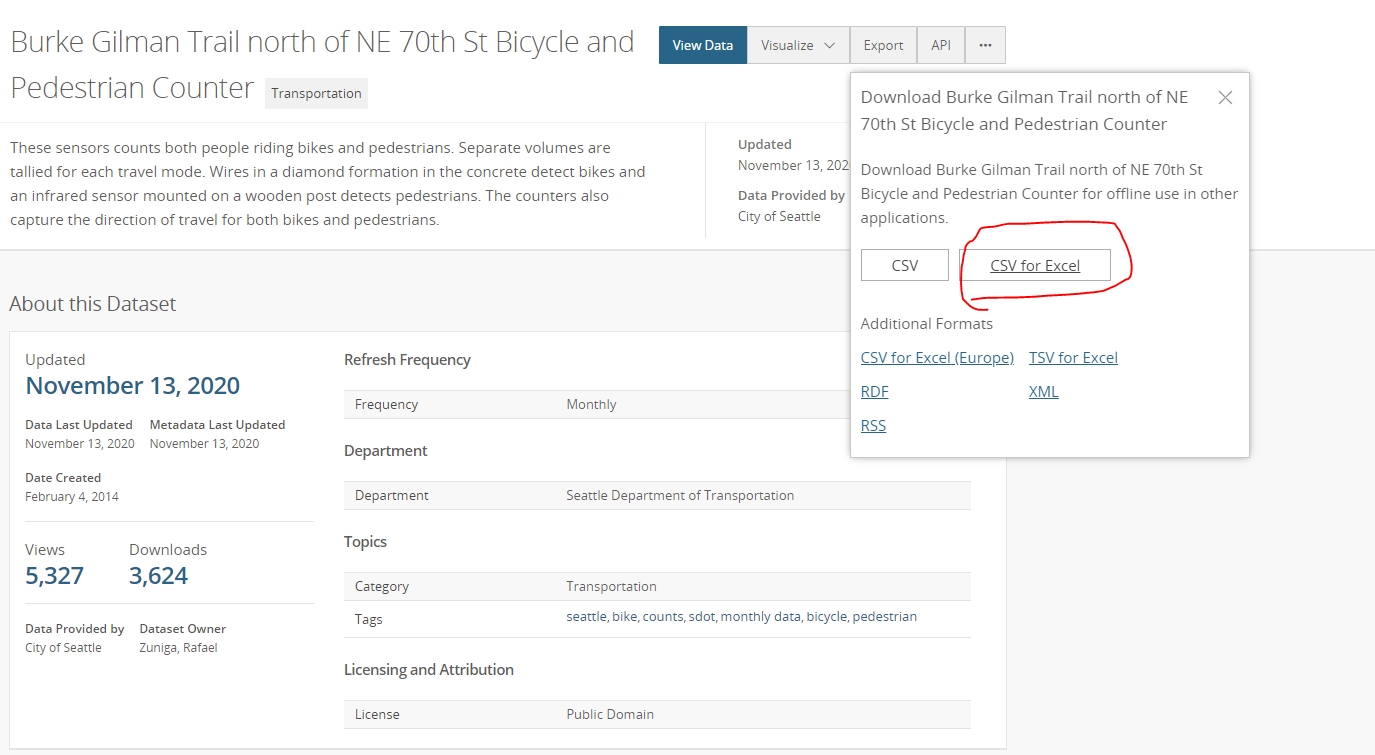
I have got the API URL (JSON file) for each bike counter. Then copy pasted it on a text input on Alteryx. Downloaded the data using download tool. Did data preparations to create format which can be useable in Tableau. However, I realised I was in trouble because found out that JSON parse tool I used had a limitations when downloading data and didn't allowed me to download all the data I needed. So lesson learned, I had to go back to the begging and download data from Csv URL instead and do all preparation for it. While doing that I learned I could get CSV URL by right clicking on CSV for Excel button and copy link address.
Example:
Step 2
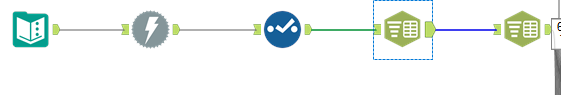
Gathered all the CVS links for each counter again then started building new workflow.
-Downloaded data, deleted unwanted columns, splitted the CSV file to columns
-Some counters had different fields in it also different information, so they needed to treat separately, seperated them by cloumn ID which I created at the beginning, then created the field name from the first row for each counter, deleted columns I don't use, calculated number of bikes for some locations where they didn't have
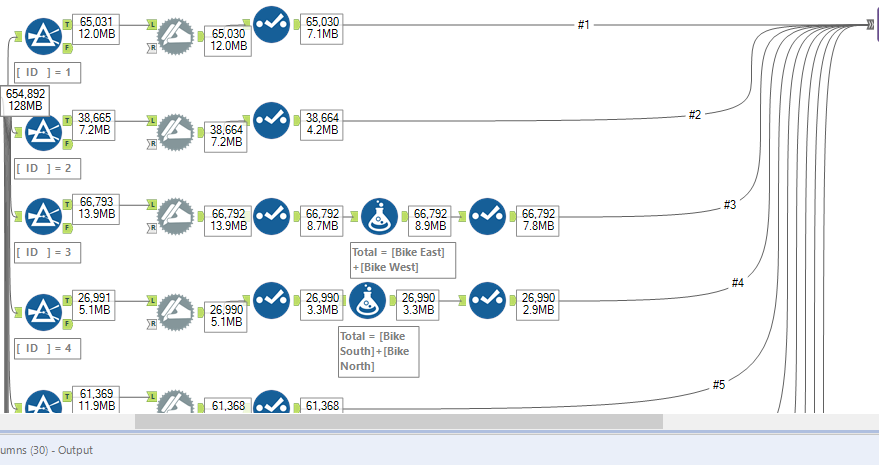
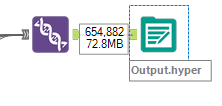
-Finally unioned all the counters, extracted the data as .hyper file to be used creating the dashboard in Tableau
This is the end of the dashboard week, I appreciate we had a lot of practice with Alteryx this week. Happy ending...