


Let's say we have created a Monthly Summary dashboard in Tableau: the user can change the date value in a parameter to see the current month's summary, or a past month of interest.
However, what will the default value of that parameter be?
If we save this dashboard to Server, to Tableau Public, or as a packaged workbook, the default date will just be the last one selected. This isn't very future-proof - if users are consulting this dashboard for an up-to-date summary, with data that is being refreshed regularly, it's likely that they will need to navigate to the current month each time they open the workbook.
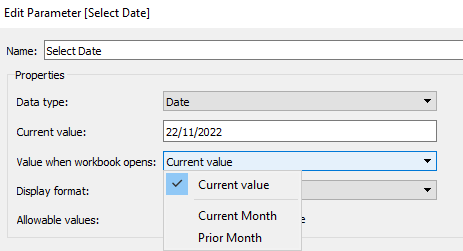
Luckily, Tableau allows us to make our parameter default values more dynamic if necessary: we can add a calculated field as 'Value when workbook opens' in the parameter menu.
Step 1: set up worksheet and parameter
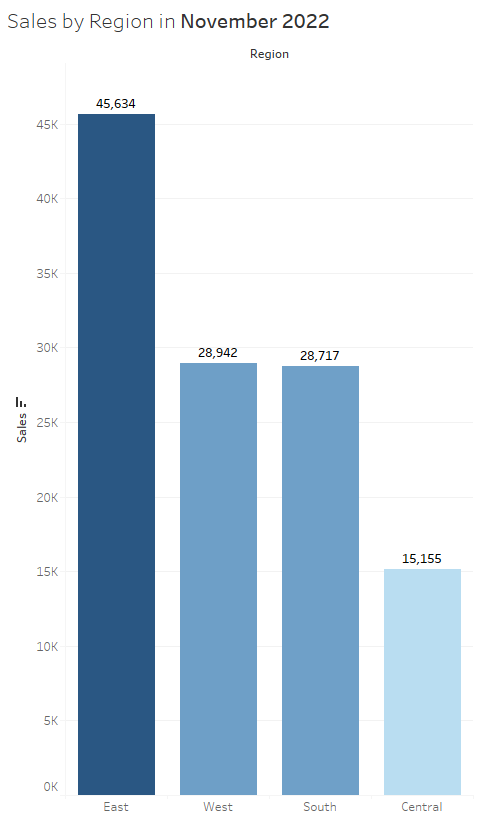
In this example, we can test this feature on a simple bar chart of Sample Superstore data. Region has been added to Columns and SUM of Sales has been added to Rows. SUM of Sales has also been used to label and colour the bars.
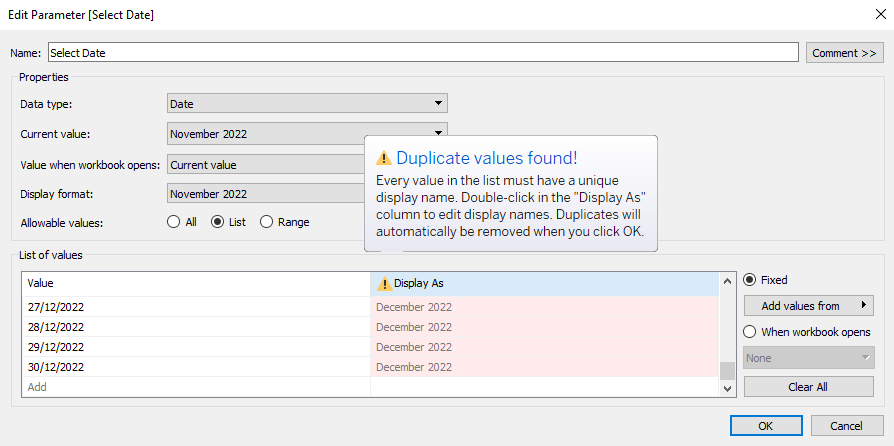
We will use Order Date as the date field for filtering to relevant sales in each month, so first will need to add the possible Order Dates as values for a parameter ('Select Date'):

Since we are looking at monthly data, instead of at individual dates, we will need to change our Display Format to show the month and year (you can select something like 'March 2001' from the dropdown, or set a custom format). If at this point you see a 'Duplicate Values Found' error message in the parameter pane, do not worry: this is because in the Month Year format, all the days in a month now have the same 'Display As' value, but Tableau will combine these duplicates into one value when 'OK' is clicked.
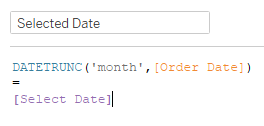
To filter the bar chart to only relevant Order Dates, we can create a simple calculated field with a Boolean condition; we will need to use DATETRUNC here to ensure we are comparing the month and year of the Order Date to the month and year in our parameter. This can then be added as a filter, set to "True".
As a final step, we can add clear signposting for the dashboard viewers by including the chosen parameter month in our chart title:
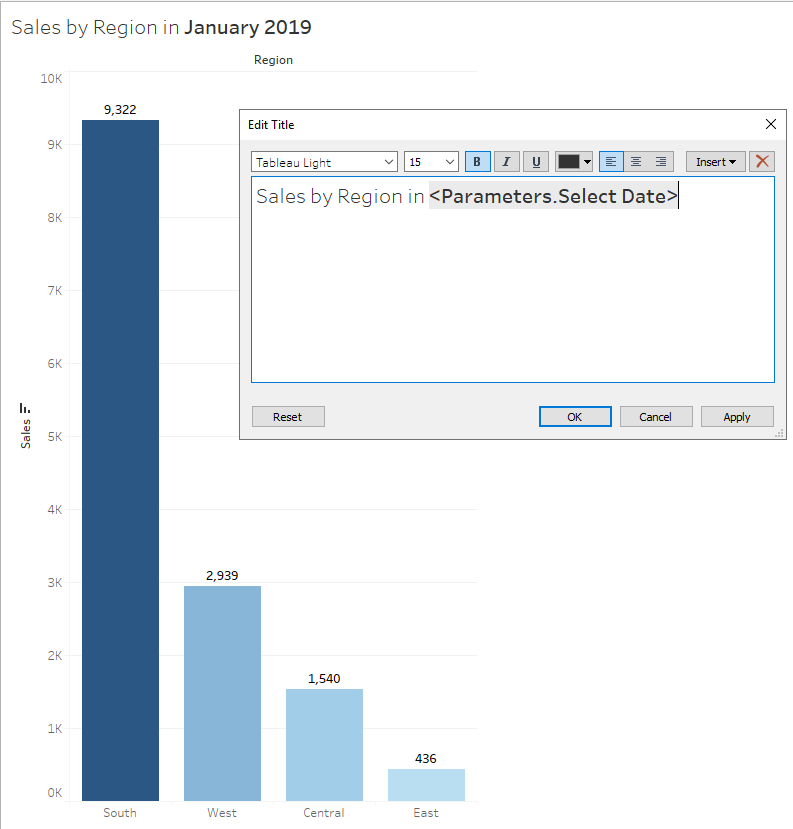
You will see that the parameter date has defaulted to January 2019, the earliest month in the list of possible parameter values.
Step 2: add the default parameter date
To set up the workbook so that it always defaults to the current month, we can make a simple calculated field that uses DATETRUNC again and returns the first day of the current month and year:

The data type of this calculated field will be date-time.
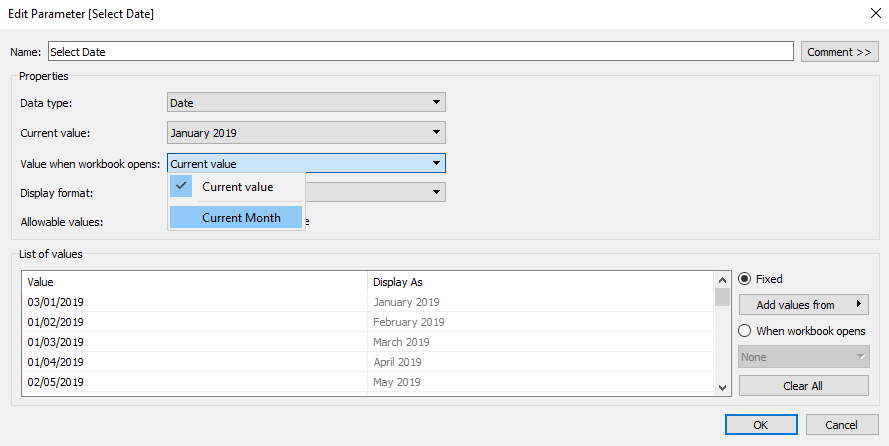
Now when we reopen the editing pane for our date parameter, we should be able to see our new 'Current Month' calculation under the options for 'Value when workbook opens':
Selecting the 'Current Month' calc and clicking 'OK', we can see that the chart has been updated to show the sales from the current month at the time of writing up this blog.
Bonus Tip
There are various other calculated fields we might want to create to set our default dates for the workbook. One thing to bear in mind with this feature is that it only seems to allow us to select Dimensions for our default date value when the workbook is opened.
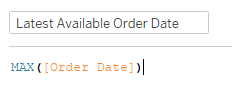
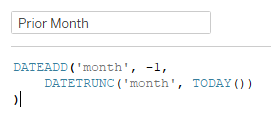
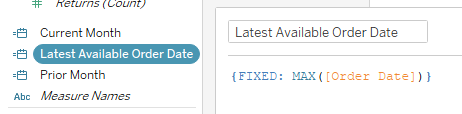
As an example, we can build two more calculated fields that might be used in this context: one that looks for the latest date where data has been collected ('Latest Available Order Date') and one that sets last month as the default date ('Prior Month'):
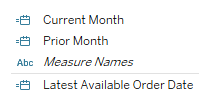
Looking at the Data Pane, we can see that these new calcs plus our Current Month calc are all blue, discrete Date fields; however, two of them have been designated as Dimensions by Tableau and fall above the dividing line, while the other has been listed among the Measures below the line:
'Latest Available Order Date' has not been listed as a Dimension, so is not an available option for us in the parameter dropdown list:
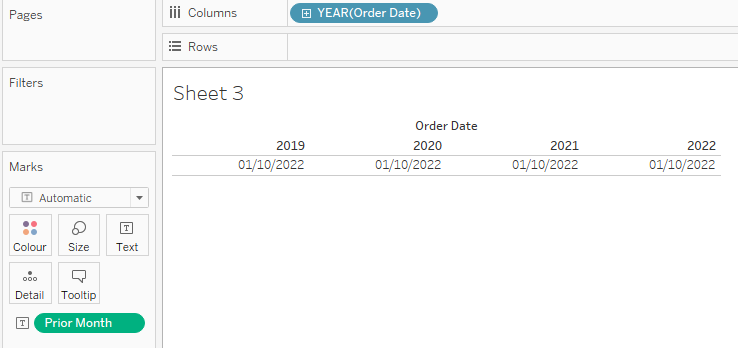
As it currently stands, our 'Latest Available Order Date' can be treated as a measure and broken down further in the view: if we added the YEAR of Order Date to Columns, we would get 4 different values for this date calc:

Meanwhile, our other date calcs act as independent variables; adding our 'Prior Month' calc to an identical sheet, we would see one single value repeated for each year, since this date cannot be broken down any further.
A workaround for this, if we need to open the workbook to the latest available month dynamically, is to FIX this calc and make it an LOD; Tableau will now detect it as a Dimension.
See other DSer blogs on Dimensions, Measures and blue vs. green for more background on how Tableau handles these different types of fields.