During DS30's very first Client Project (AllChains), I was tasked with creating a dashboard for Purchasing data: one of the questions I aimed to answer was 'do we need all of the products we are purchasing?'
Some messy data aside, I found this question hard to address: I wasn't sure what chart would be useful for identifying and visualizing 'unnecessary' product lines.
The solution I came up with is maybe not perfect, but ended up being one of the stronger parts of my final dashboard. I used a scatter plot of all the product IDs with the axes 'Quantity Purchased' and 'Profit', and added a highlight colour for all products that were being purchased in large quantities, but were actually not generating much of a profit.
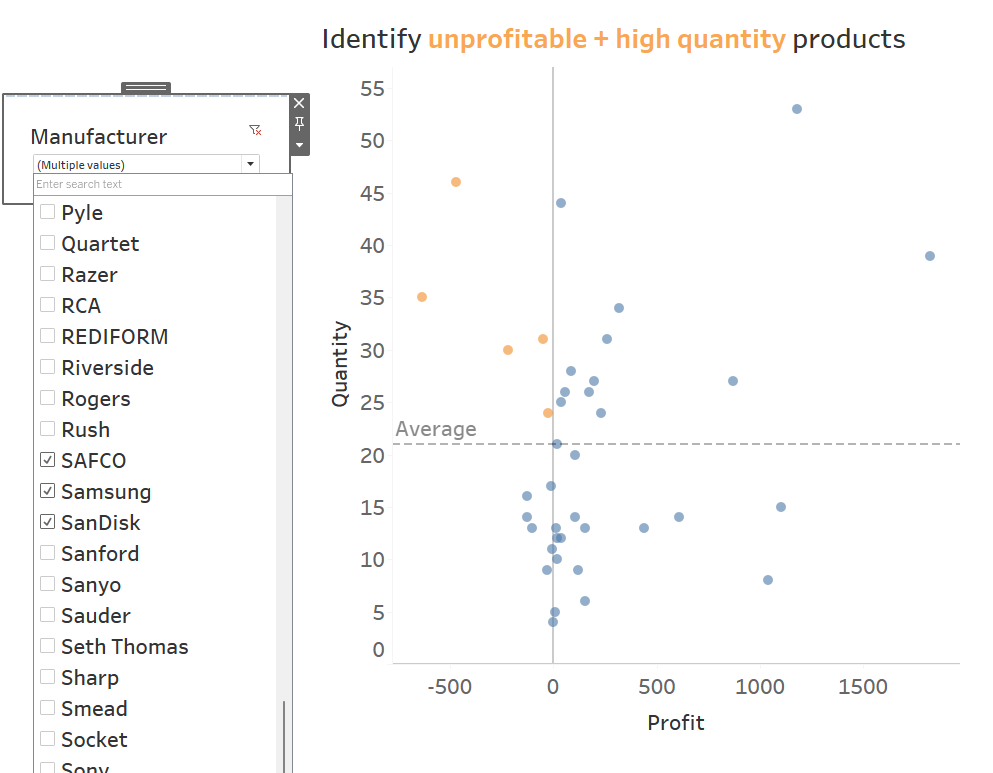
The user could then filter the chart by Category and Subcategory, to compare all products of a similar type, and identify any products that might not need to be purchased in such great quantities. The highlighted quadrant would change depending on the user's filter selection.
We can build a very similar chart using Sample Superstore.
What it looks like
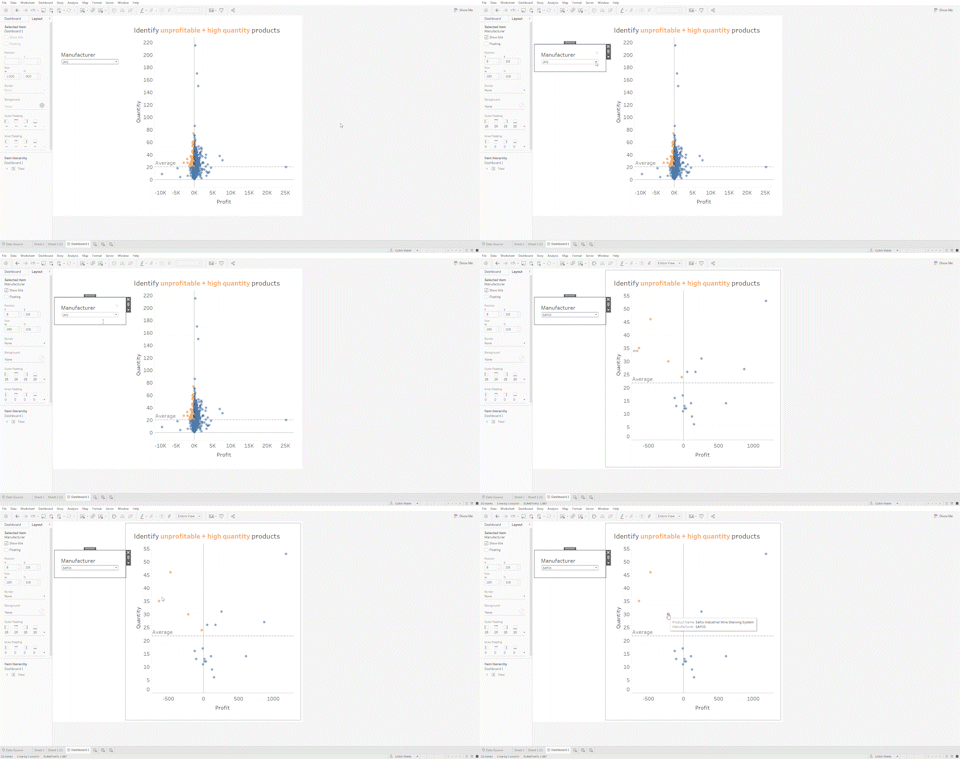
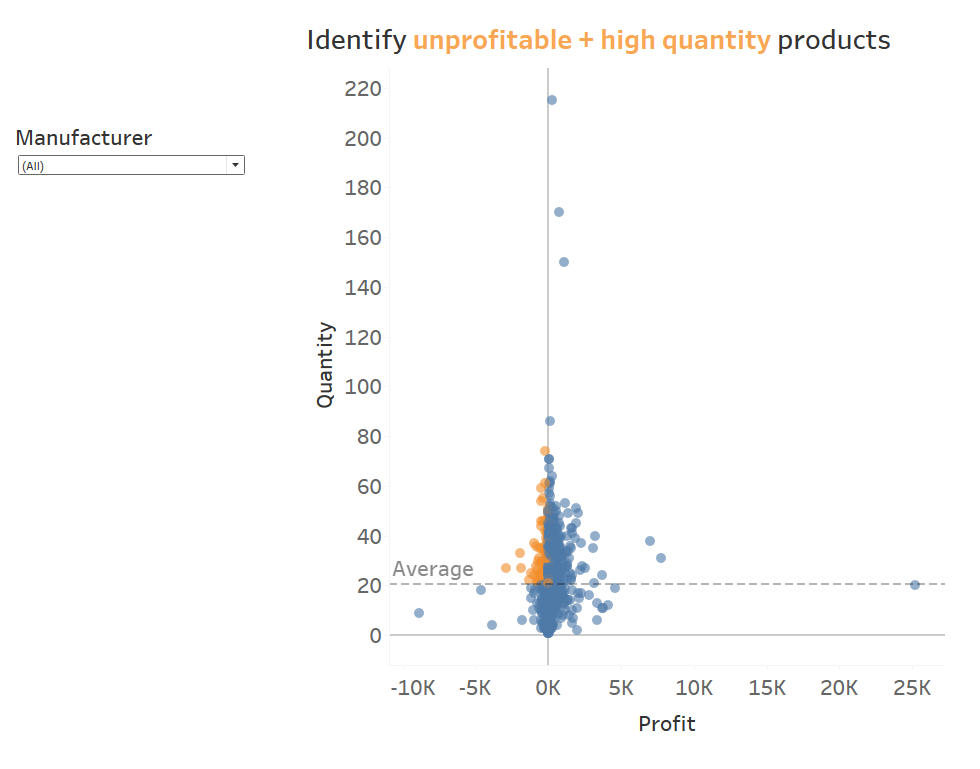
Initial chart view:
Filtered down chart:
How to build it
This Superstore version of the chart visualizes which unprofitable products are being sold in above average quantity.
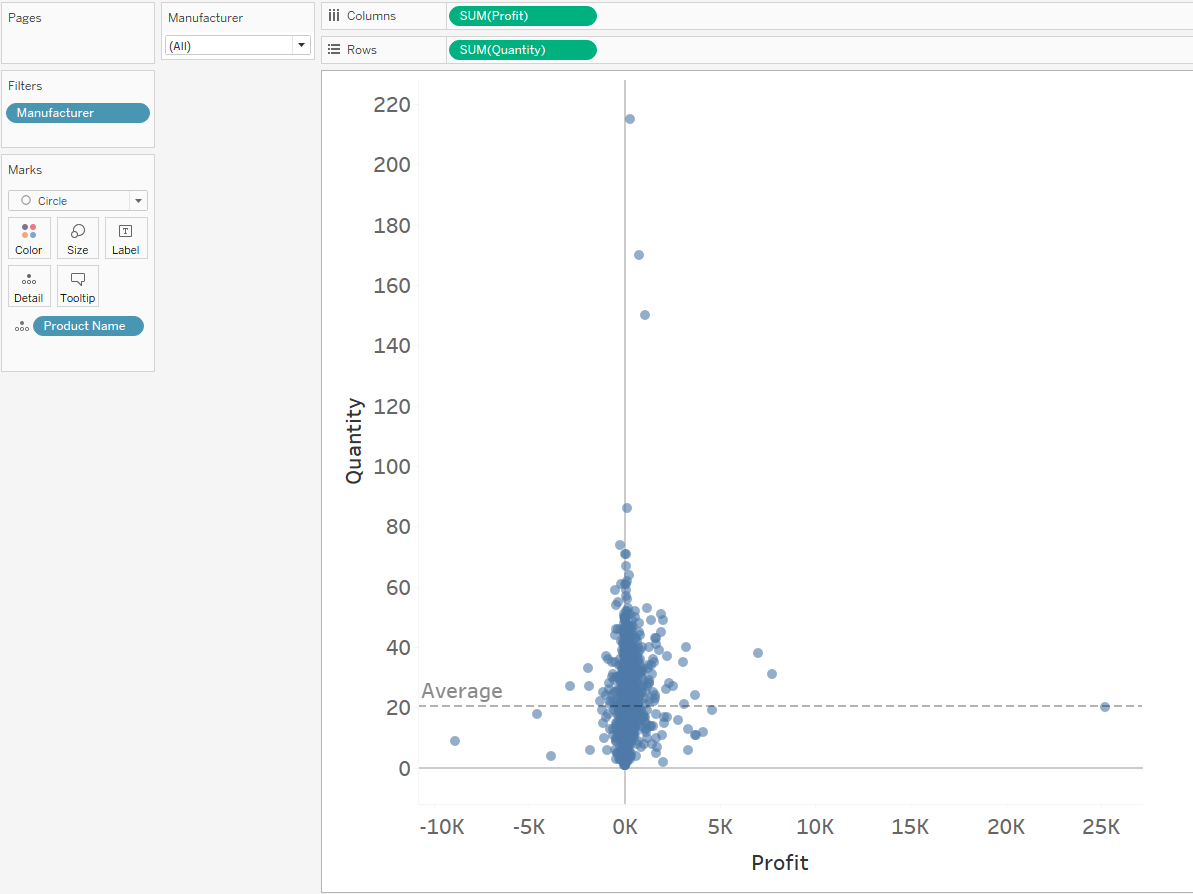
We start by adding 'Product Name' to the Detail shelf, with 'Quantity' and 'Profit' on the axes:

We will be filtering by 'Manufacturer' so can add this to the Filter card, and right-click to select 'Show Filter':

Right-click again to change the filter to a drop-down menu.
The quadrant we want to highlight will be made up of any products that a) are generating negative Profit, and b) have a below average Quantity value.
We can add in an Average line to help visualize this, dragging one in from the Analytics pane:
We can now start building our calculated field in order to colour this upper quadrant in our orange highlight shade.
In plain English, we want to select all of the points where it is true that the Quantity of the Product sold is above the average Quantity in the current view, and where the Product made a Profit under zero dollars.
This is the calculated field that I used, which uses a Table Calc and is a Boolean type:
SUM([Quantity])>WINDOW_AVG(SUM([Quantity]))
AND
SUM([Profit])<0
When you first drag this calculated field onto the Colour shelf, there will be no change; we need to make sure the Table Calculation is being computed the way we require:
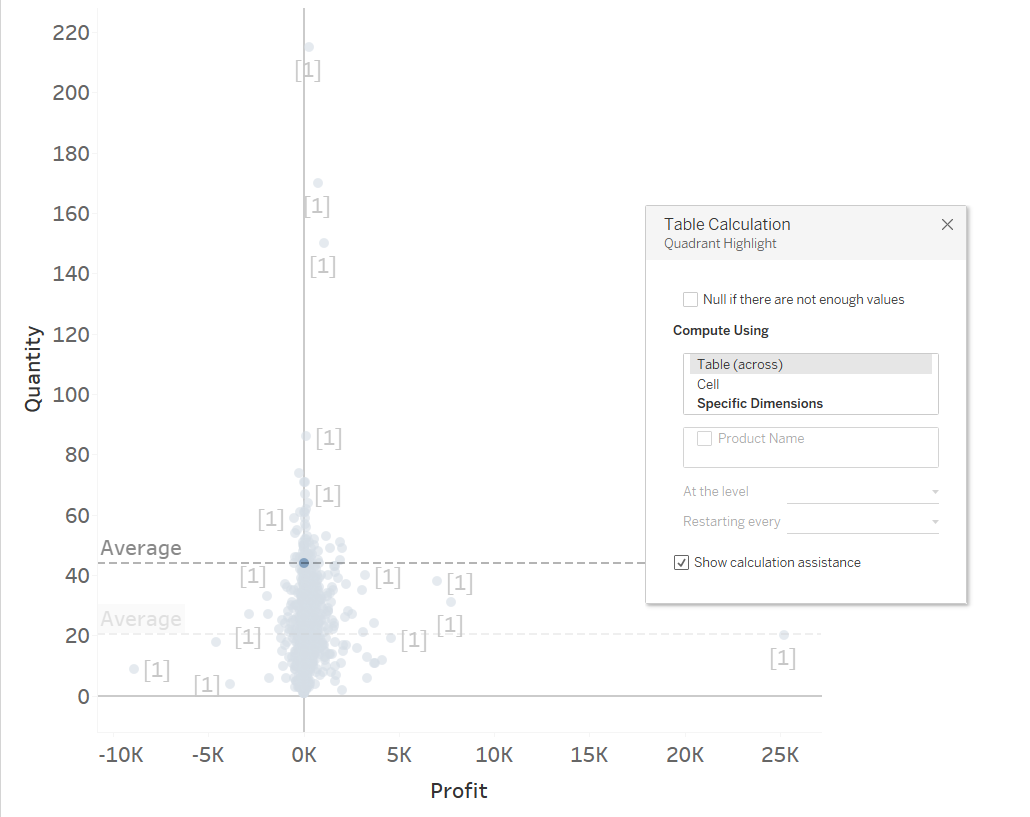
We can see here that Tableau automatically runs this calculation across the table: each Product is only being compared to itself.
We need to instead select 'Compute Using Specific Dimensions', and compare all of the Products in the view together:
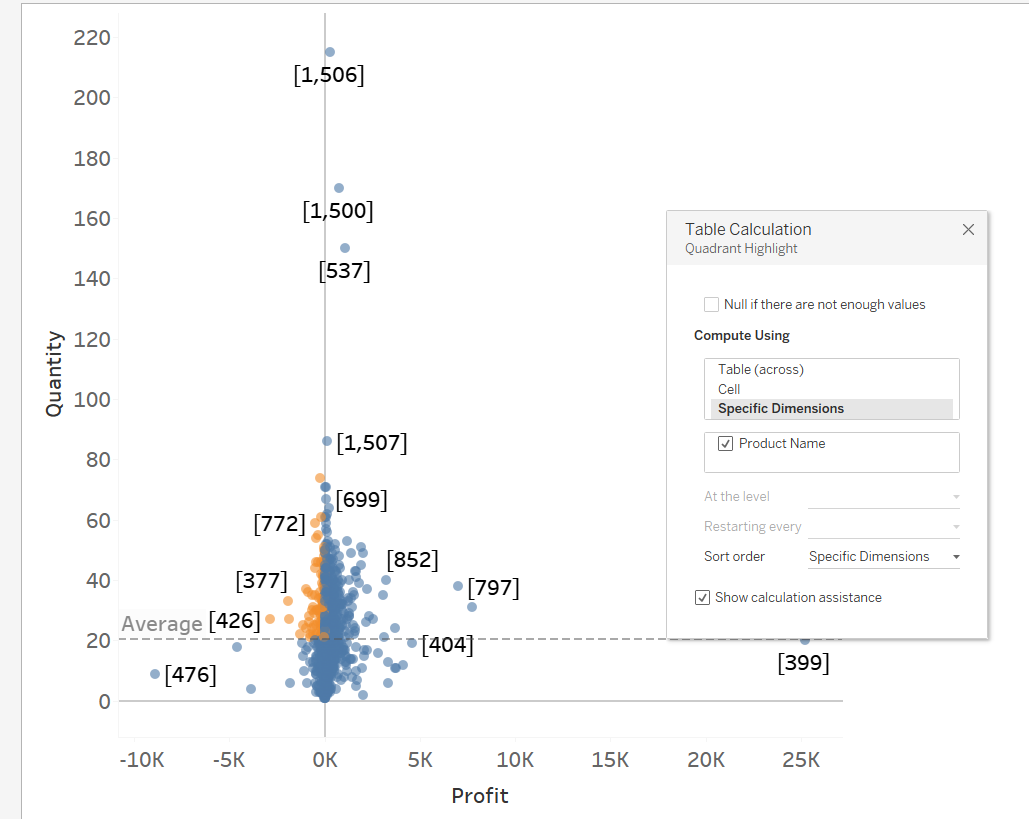
We can now see our calculated field working as expected, colouring the top left quadrant in orange.
As a final step, tidy up Tooltips: I added 'Manufacturer' to Detail so that each point on the scatter has information on the specific product, and the Manufacturer responsible for it.
Bear charts like this in mind for storytelling with your dashboard: our goal is often to make it as easy as possible for a user to glance at a chart and gain insight from it, and bold highlight colours do a lot of the heavy lifting for us!
