


I love teaching (especially at The Data School) because I always end up learning something new or a different way to do something that previously I have never come across. I thought I would share a selection of these from the last week:
1. Random is better than Index
Everyone loves jittering and for years, I have remained ‘Old School’ by continuing to use the Index function to jitter dense data out across an axis. So why am I suddenly a convert to the ‘New School’ of using the Random function – because you don’t need to do anything in terms of the table calculation. With Index though, I need to control the table calculation to get the variation across my data – that sometimes is harder than it should be. Random just works so use that were possible everyone (not always possible with every data source).
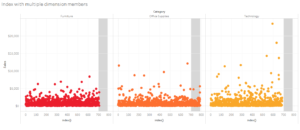
Here is an example that I have just created the index() calculation but the distribution of customers when a dimension like Category is added is far from ideal. Why does my Office Supplies only have Customers in the range of 700-800?
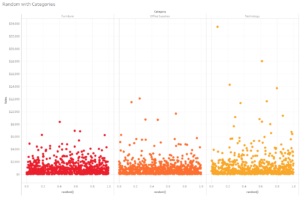
When I saw random() used instead of the index() there always seems to be a much nicer distribution. Just make sure you make make a Continuous Dimension for the neatest effect:
2. Remove the Whiskers in Tableau
I love a good box and whisker chart – it’s a great way to show the overview of a distribution. Here’s my favourite use of mine The downside of them are that most people have never been taught how to read them. So how can you simplify them? Take away the whiskers, let the data sit in front of the box and the data will show the outliers anyway.
Tableau natively draws the box and whisker chart with whiskers that are x1.5 the length of the interquartile range (the length of the box). Most people in the big, wide wouldn’t intuitively know this so Coach Kriebel’s tip is to simplify this. Here’s the original:
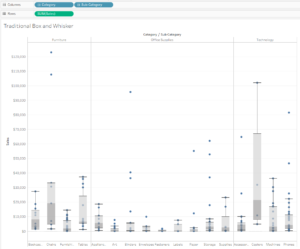
Notice how the data is hidden by the boxes and whiskers. The shades of grey make this hard to see the data – that’s what we are trying to do ultimately! And by removing the whiskers… oh wait, Tableau doesn’t just let you remove the whiskers so you need to rebuild the box from scratch. To do this you need to complete the following steps:
Firstly, most of the hard work is done for you in the Analytics Pane as there is an option to bring in a ‘Median with Quartiles’. Adding the lines on the quartiles in the format menu definitely make the ‘box’ pop but most importantly the data is still leading the way.
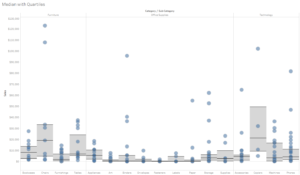
But why not add these first tips together and jitter using random()?

Much better than the first box and whisker chart.
3. Having in SQL
I used Structured Query Language (SQL) for years in a previous role but sat in on Coach Kriebel’s famed SQL class last week as it’s been a while (read a few years) since I last typed a SELECT statement in anger. Andy covered the subject brilliantly and what took a week in formal training took the tenth cohort a few hours to learn but one aspect was relatively new to me…. HAVING.
For example, if I want to bring back my Sub-Categories that have sales greater than 100,000 then here is the additional line that acts as my filter for me in my query:
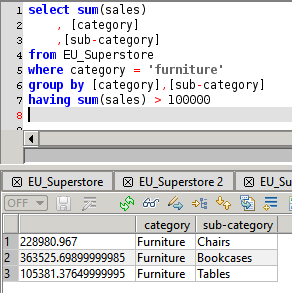
Having is an instruction at the end on your query to act as an aggregated filter. As most of my SQL work is now a distant memory, maybe I did use it or maybe I always applied the aggregate filter elsewhere but it’s a great addition to my SQL kit bag.
4. Webpage in Alteryx Designer
This tip came up in our eleventh cohort’s presentations. It was their first client project but one aspect left my jaw on the floor as I’d just never seen it before – adding a live webpage to you Alteryx Workflow in Designer.
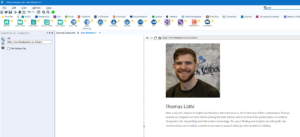
The way to do this is with an ‘Explorer Box’ tool. How have I never come across this I have no idea! Thomas Luthi just popped his workflow up on the screen and referenced a site that we needed to be aware of – genius!
So how do you use the Explorer Box tool. Well when you first drag the tool on to your canvas, then Alteryx defaults to the alteryx.com home page. From there, you can then use the Configuration Pane on the tool to enter the page that you want to show.
Let’s give credit where it is deserved to Thomas for introducing this technique to me. Thanks Thomas!
Let me know if these learnings are useful with a tweet or comment and I will share more as I learn more (shouldn’t take long judging by last week!).