


Today Andy promised the data would be easy and that minimal prep would be required. What we were not told was that we would have to experiment and create a dashboard on Power BI for the first time!
Data Preparation
The data for today was about long term productivity, using different measures to analyse it across several countries from 1890 to 2018. The data was all nice and clean in one Excel file, with several sheets. So the Alteryx flow was simple enough, consisting of some Select tools to clean up empty columns and rename a few fields and some Transpose tools to have the data ready for Tableau and for Power BI in a more usable format.
Power BI
Once the I was done with the data prep, I decided to start by using Power BI instead of Tableau as it is the more unfamiliar tool and I did not know how long it would take me to make a dashboard.
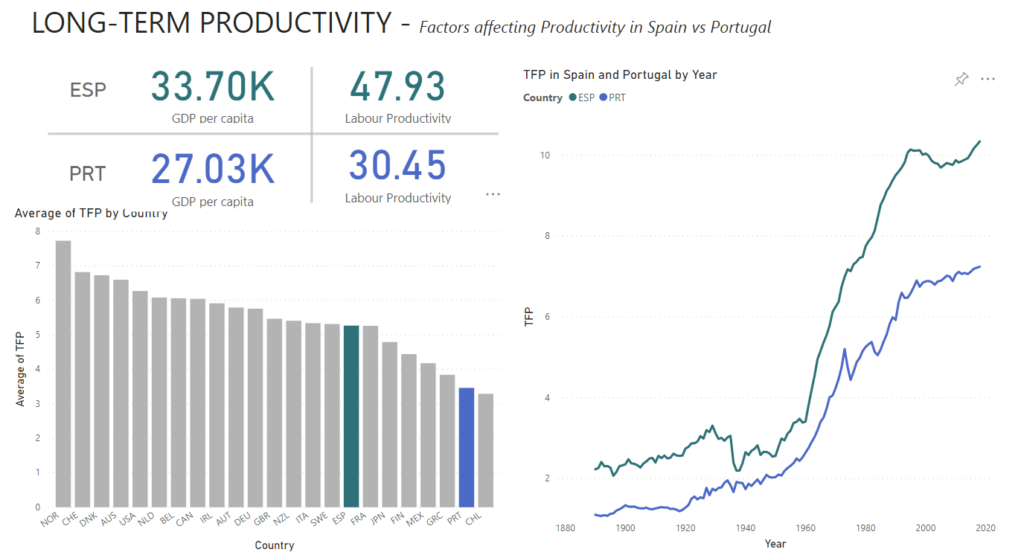
First step: download Power BI. This already posed a few problems as the sign in window gave me an error several times before it worked. Next up, after I opened Power BI and had a look at what the tool was like, I started to plan what I wanted to show. There was a significant amount of data in the data set so I decided to narrow it down so that I could explore Power BI better. For this I chose to compare the productivity of Spain vs Portugal.
Playing around, this is what my final dashboard on Power BI looked like:
Once I had done this, after lunch I started to work on my Tableau dashboard. I didn’t really want it to look the same as the other one so I chose to focus more on doing a more interactive KPI dashboard instead.
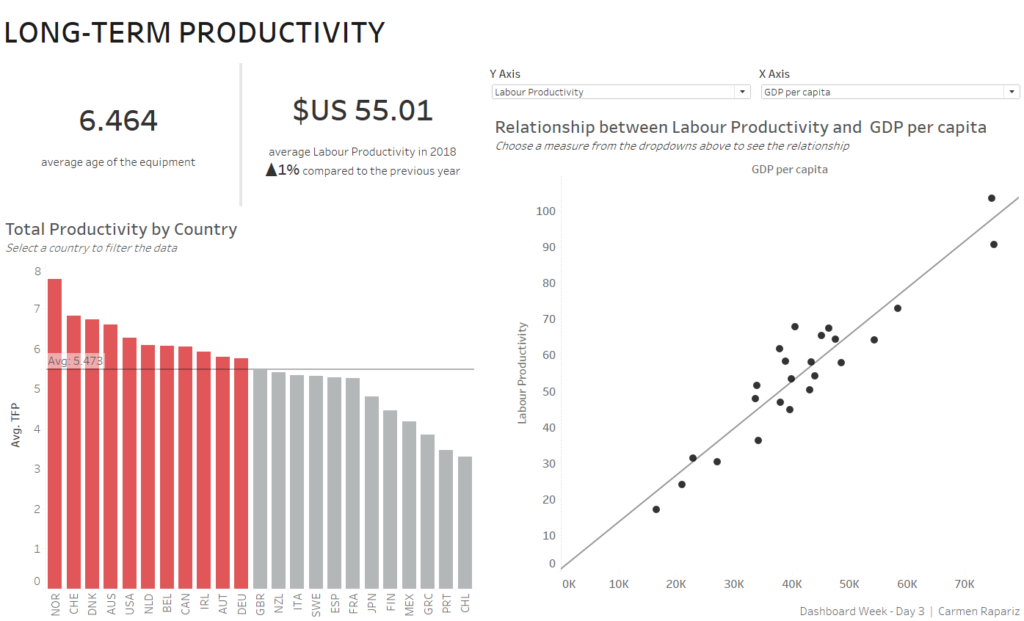
My Tableau Viz is available here:
https://public.tableau.com/views/DashboardWeek-Day3/DashboardWeek-Day3?