


You create a beautiful dashboard (or a suite of dashboards) that you spent days, if not weeks, on. After all that effort, the end-user asks "can this be PDF'd"? Worst of all, you have several filters in the dashboard(s) and there is no easy way to generate PDFs for all cuts natively through Tableau. Although it may be heartbreaking, sometimes PDFs are an absolute for stakeholders, especially senior-level users. To navigate this tricky situation, I built a highly-modular method to print Tableau PDFs and today, I'll show you how.
Some Context
First, I'll lay down some context. Below is a wireframe of a typical workbook I built for my client. The first dashboard is a static summary page; the second dashboard is an interactive drill-down; and the third contains miscellaneous notes.
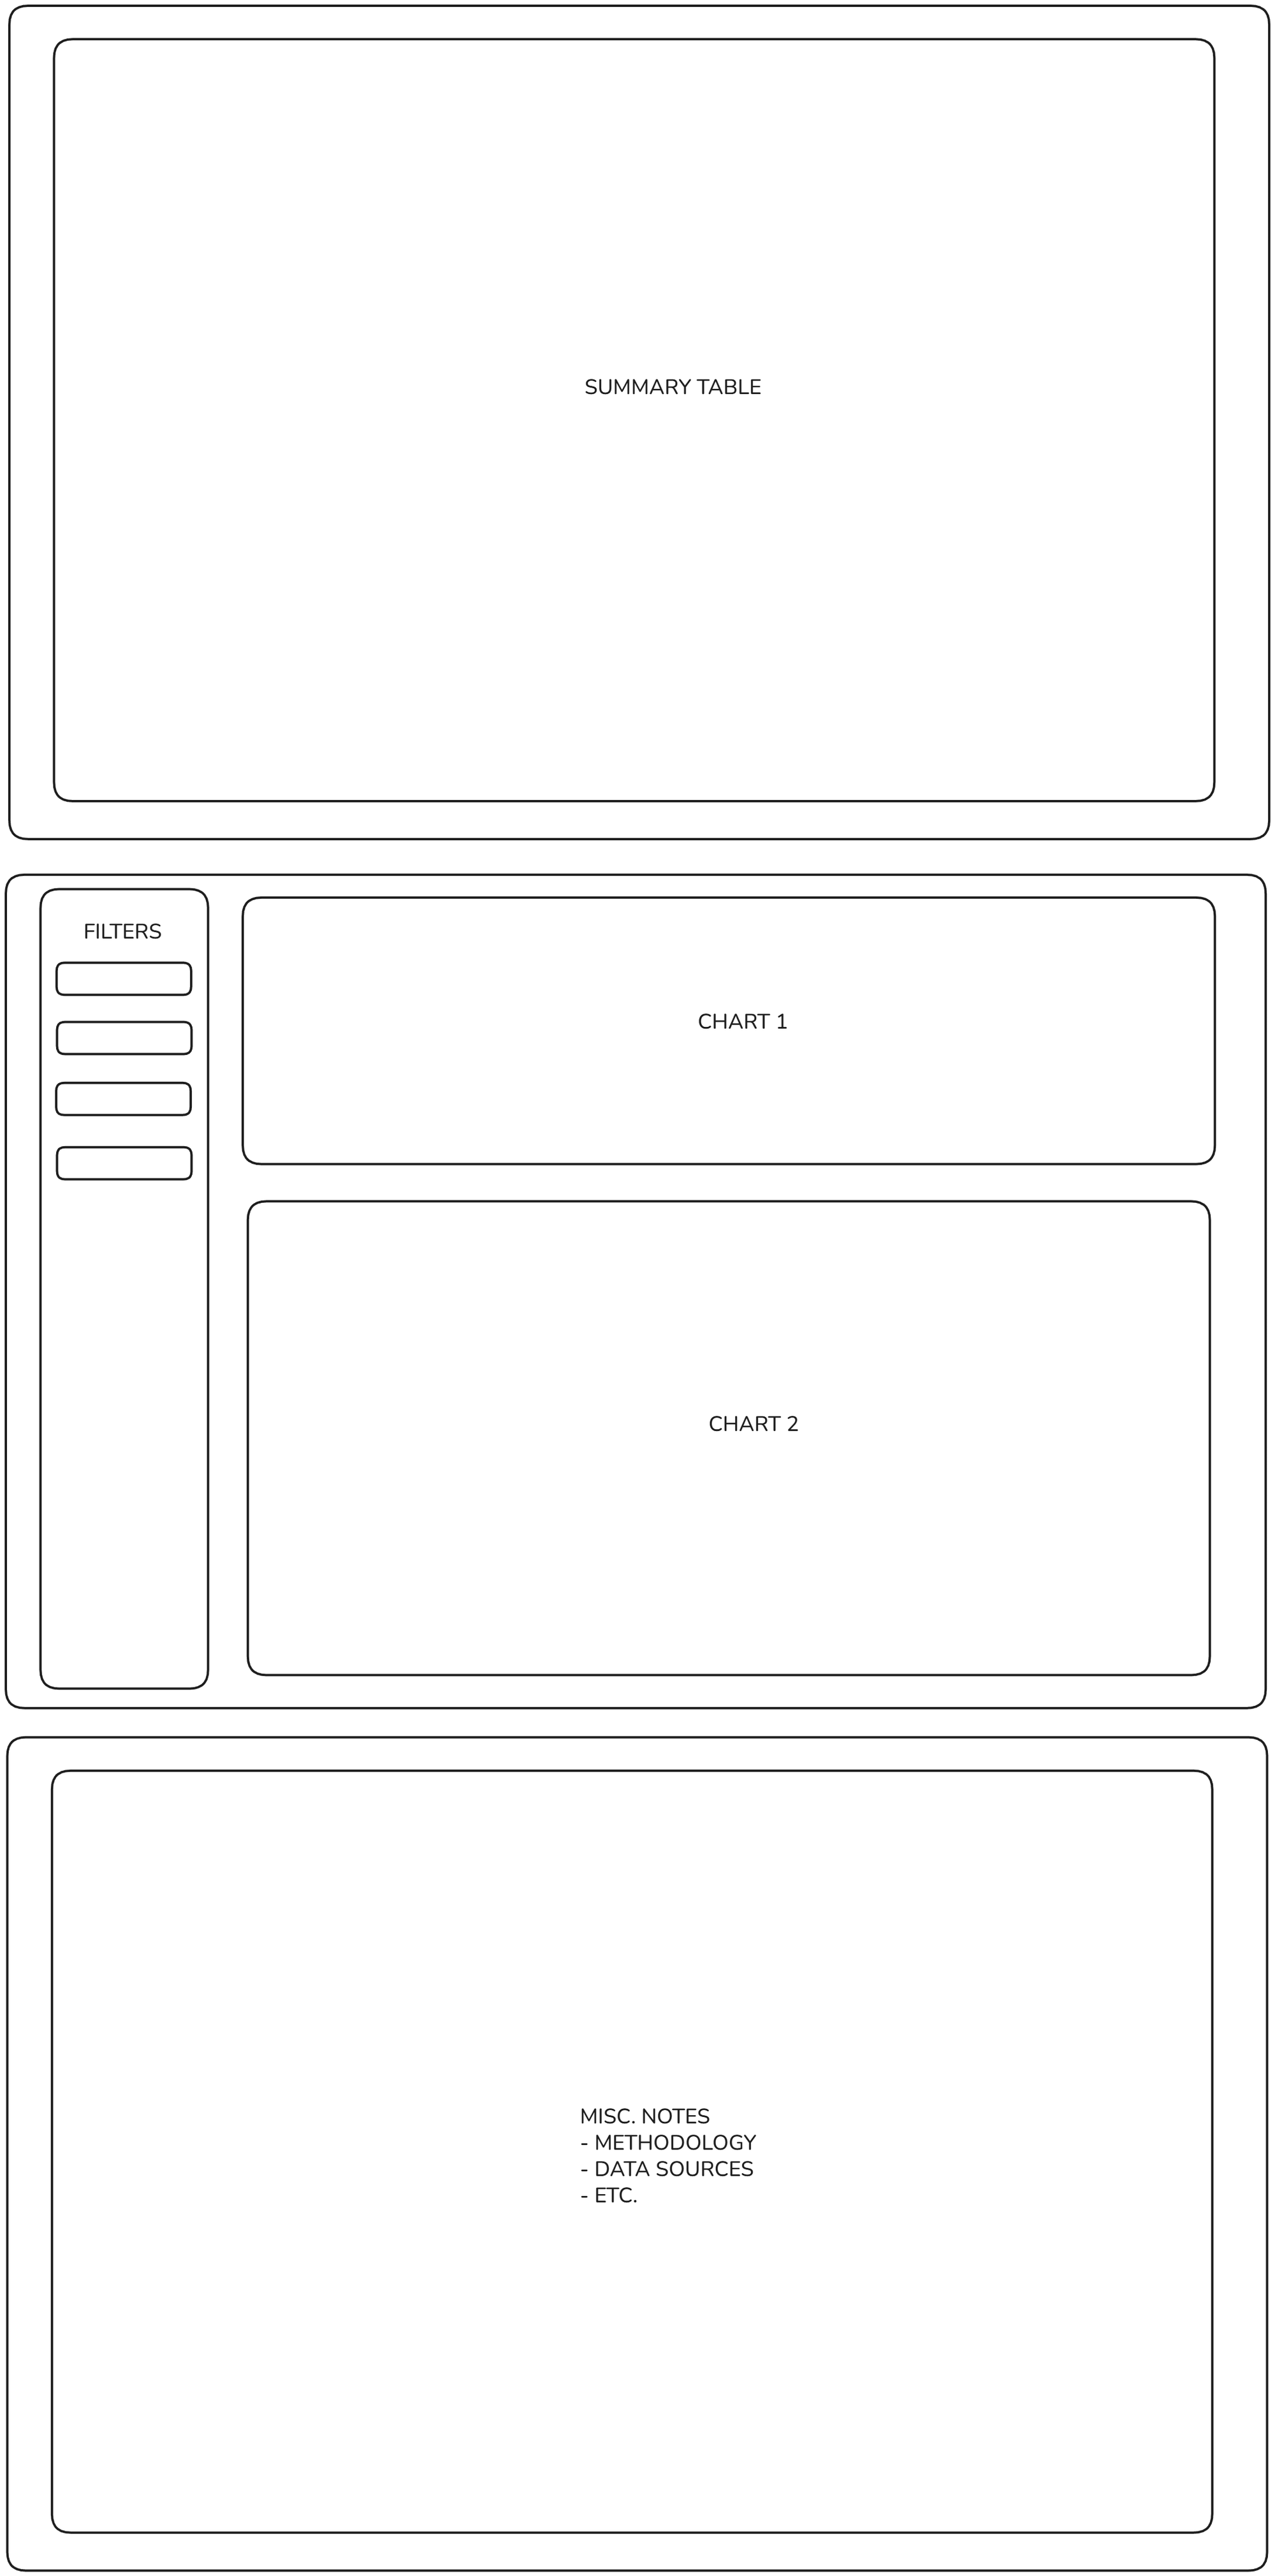
The client would ask to print the summary table dashboard, any number of cuts from the interactive dashboard, and the notes page - all in one PDF. This is extremely tricky, if not impossible, to do natively in Tableau. Despite my best efforts to push users to interacting with the dashboard itself, this was not an option for some senior-level stakeholders at my client.
The Problem
In trying to find a solution, I first broke down the problem into broad requirements.
- I needed to be able to print both static and interactive dashboards.
- I needed to be able to print any number of dashboards, even dashboards that did not belong to the same workbook.
- I needed to be able to loop through any number of filters with ease, while still having the ability to intervene to exclude certain values.
I had experience printing very basic dashboards by looping through a filter using Tableau's REST API, so I knew I just needed to somehow extend that capability. And because the client was a heavy python user, I decided to tackle these problems in code.
Inspiration
Before I jump into the solution, I want to point out what inspired me towards my solution. My inspiration was none other than Tableau Server Client (TSC) itself - the python wrapper to Tableau's REST API.
If we dig into TSC, there is a class called _FilterOptionsBase, as shown below.
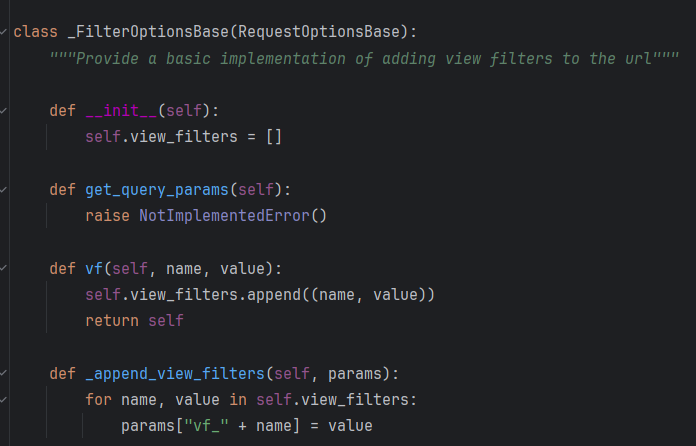
This class allows view filters to be added recursively. For example, if I wanted to toggle more than one filter in a view, I could do so by interacting with this class. A class in python is akin to a blueprint. Let's say we want to build a car. We would probably want to start out with a blueprint of some sort. Then, we would execute the blueprint in some order to actually build the car. Similarly, a python class (at least as I have used it in my solution) is going to hold a blueprint and the executable steps to materialize that blueprint. In our case, the blueprint lays out the steps to create a PDF (a lot less interesting, I know...)
Instead of adding more view filters, I needed to able to add more views. So I took the framework of this class and, to put it simply, just moved it up one level so that it could store as many views as needed.
Solution
Let's dive into the solution. I'll start with the broader framework and then dive into some details.
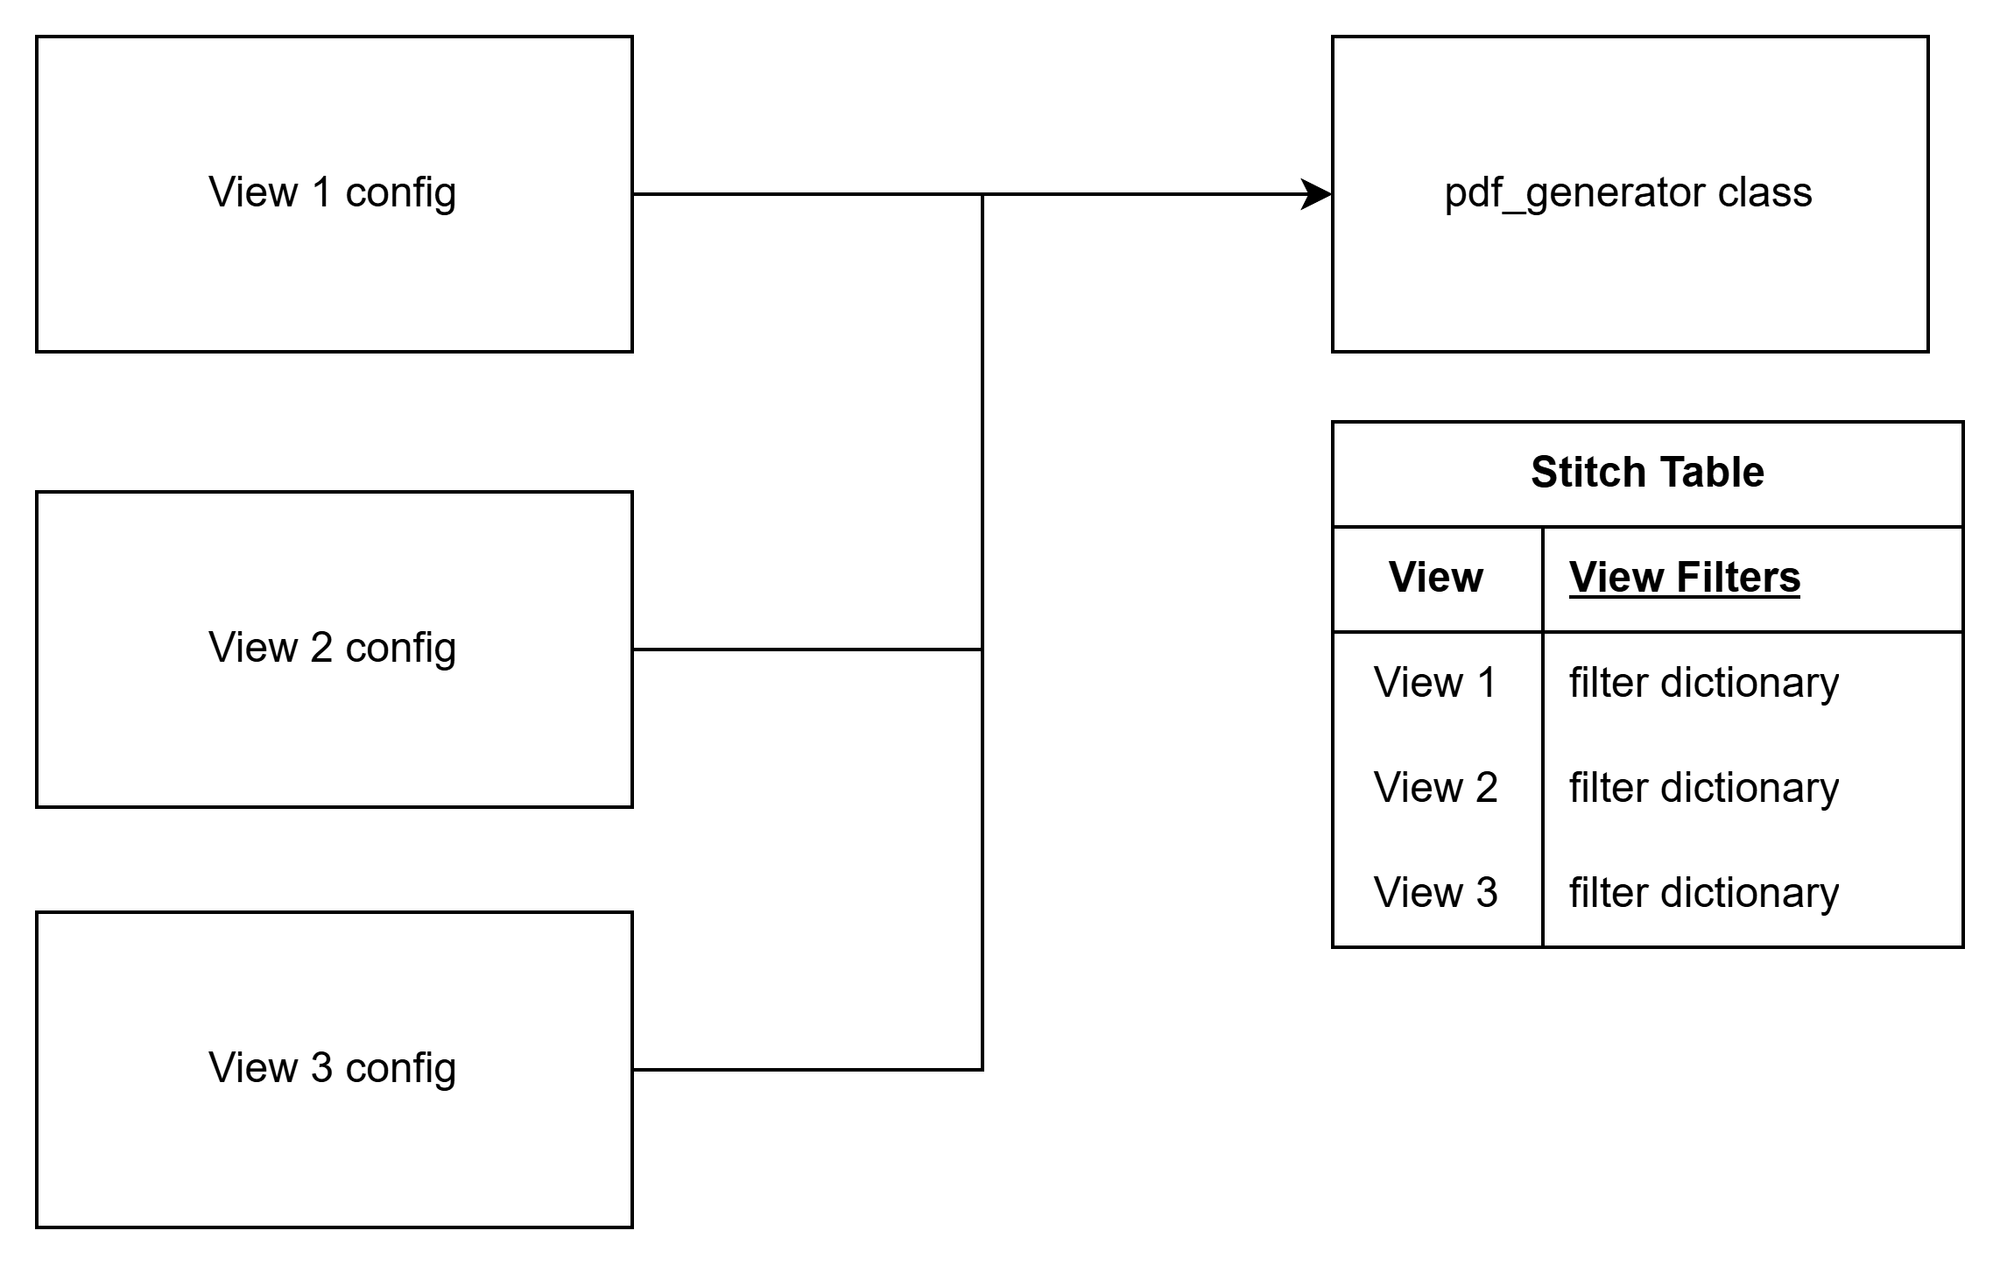
Below is the big-picture of how I set up my class, which I call "pdf_generator." Through an executable step within the class (hereafter called method), the class can "record" the configurations of each view separately. The recording happens behind the scenes in what I call the "stitch table." This table stores the configurations of each view until the PDF is ready to be generated.
The stitch table records all information needed to generate the pdf for that view, including:
- The name of the view and the workbook it belongs to
- View filters (in a python dictionary)
- Page order
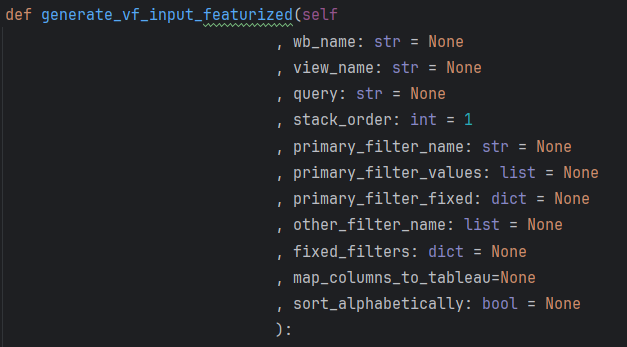
The method that I'm using to record the configuration of each view has several optional parameters to allow the user to dial-in how they want to view to be printed. For example, users can select to loop through multiple filters, or loop through a select few while fixing others to set values. Users can designate the page order of the view in the PDF and decide how to sort the pages in the view. The method even allows for multi-selecting filters. Theoretically, we could add any number of views (even from different workbooks or the same view multiple times with different configurations) to the same instance of pdf_generator, and the class will store the information of each view until it is ready to print.
Once all views have been inputted, the user calls upon another method in the class called "generate_pdf". This method takes the final stitch table, arranges views in order (more on this later), and then passes it into TSC (and ultimately the _FilterOptionsBase class). The result is a neatly packaged PDF created from potentially multiple views. Optionally, users can decide to embed or attach the PDF in an email.
Ultimately, this solution solved most of my problems by allowing users to tailor each view individually, while using a python class to package those views under one process.
Nice to Haves
The overall structure of the class worked really well; however, I wanted to make it as easy as possible for users. There were a couple of things on my list:
- Dynamically generate view filters by using the underlying data source of the view, so that users won't have to construct view filters from scratch.
- Map columns between the data source and the view. For example, if a user changed column names in the workbook, I wanted the class to automatically map it back to their original column names as depicted in the Snowflake table.
- Build in logic to hierarchically nest views. This is a little hard to describe so there is a screenshot below.
I solved problems 1 and 2 by integrating Tableau's Metadata API into my class.
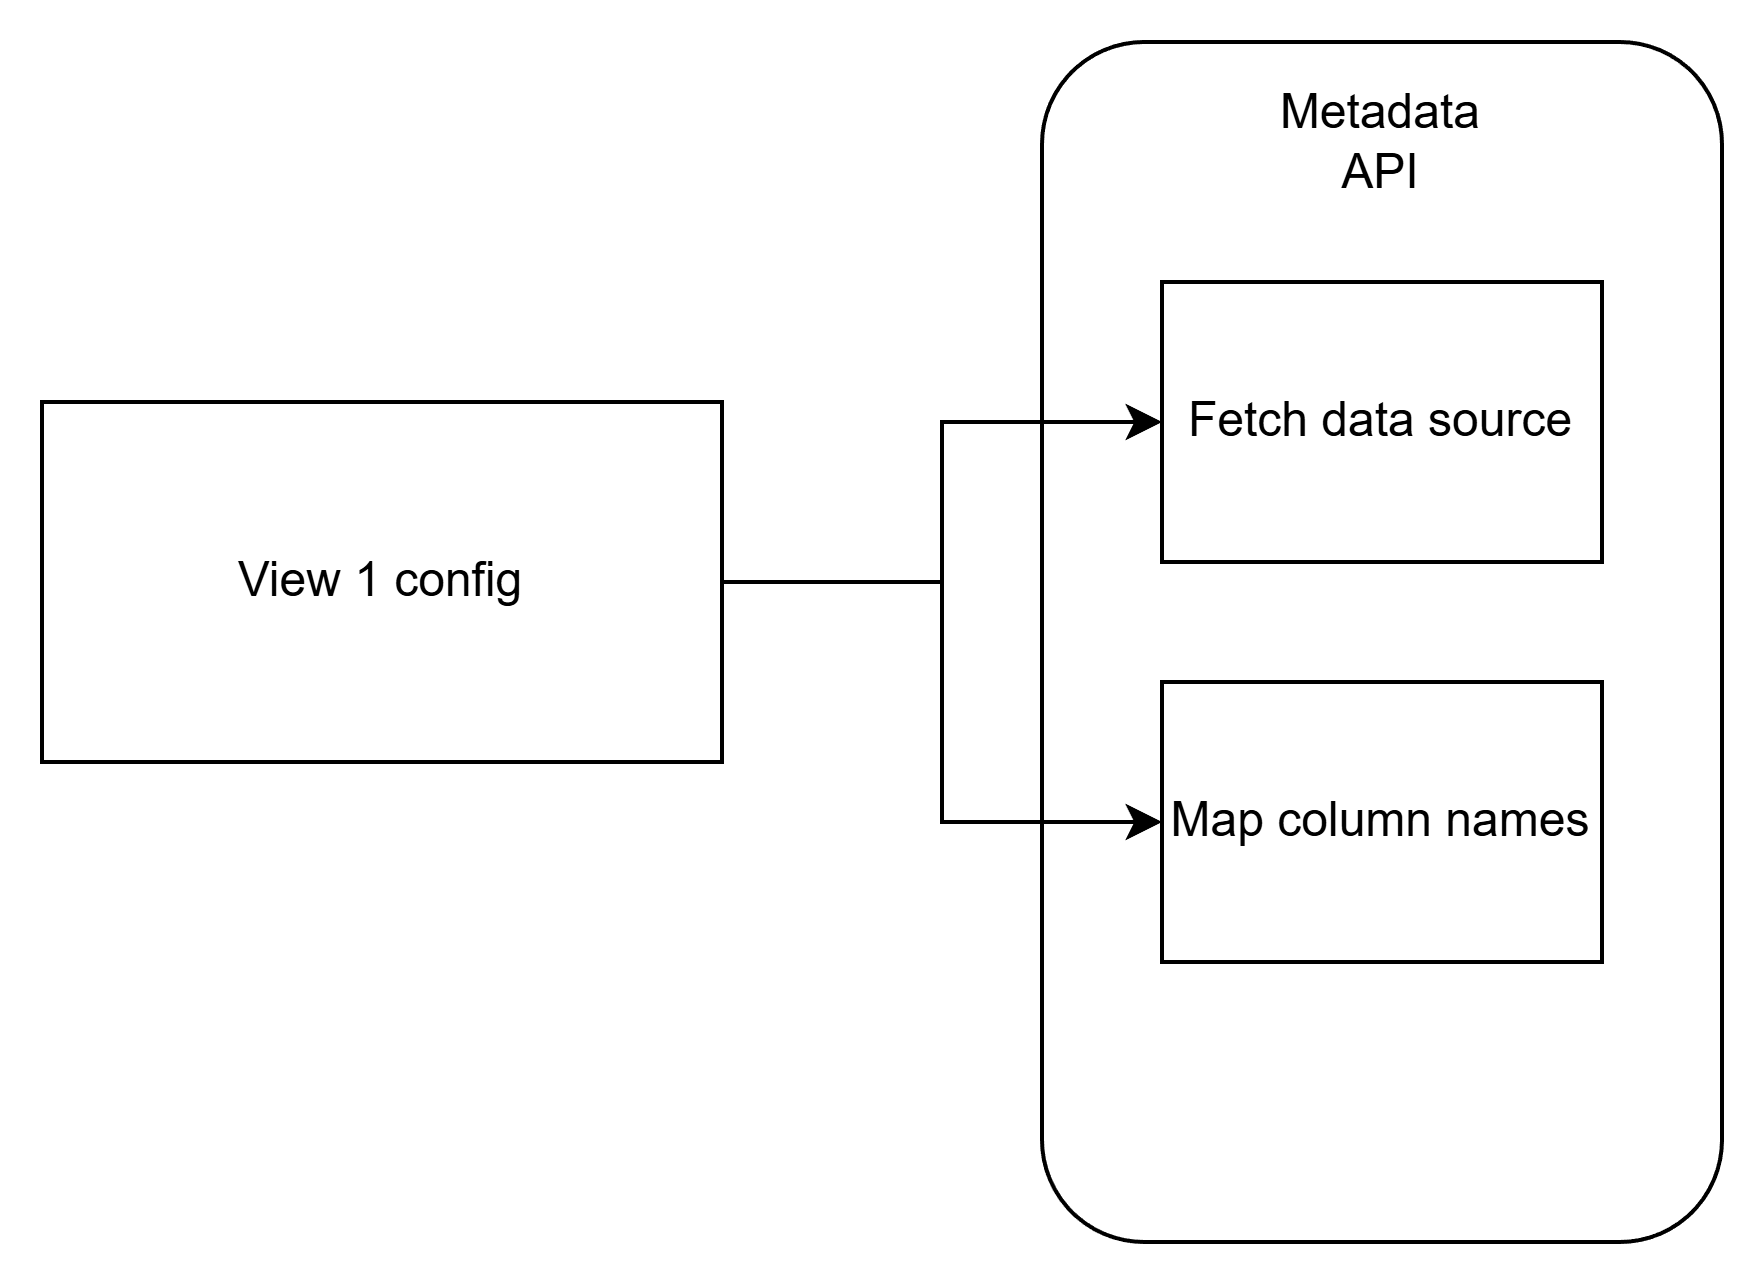
Whenever a new view is added to the class, a background process automatically pulls the metadata for that view. First, the class identifies the data source for that view. Most of the data at the client was stored in Snowflake. Whether the data source was an extract or live, the API was able to grab the exact relation of the data source, including database, schema, and table name. I dynamically constructed a SQL query based on the relation to the grab the data using cursor. I don't actually grab the entire data but perform some preliminary filtering to save time and memory.
Before any further action with the data, I use the view's metadata to map column names between Snowflake and Tableau. This potentially saves users from having to jump back-and-forth between applications to figure out original column names. Finally, the data is used to programmatically generate view filters based on user input so that they don't have to build filters from scratch. This enables users to print every combination of filters in a dashboard by just declaring the columns to loop through (although this rarely happens).
Next on my list was to find a way to optionally stack pages in some hierarchy. The wireframe below lays out the scenario. Let's say we have two dashboards we want to print. The first is an interactive dashboard that contains summary data per sector. The second is dashboard used to drill-down to subsectors within those sectors. Without a sorting logic, the PDF will print all sector summary pages first, then all subsector drill-down pages. This may be fine but based on client requirements, I needed an easy way to "nest" drill-down pages under their relevant summary pages.
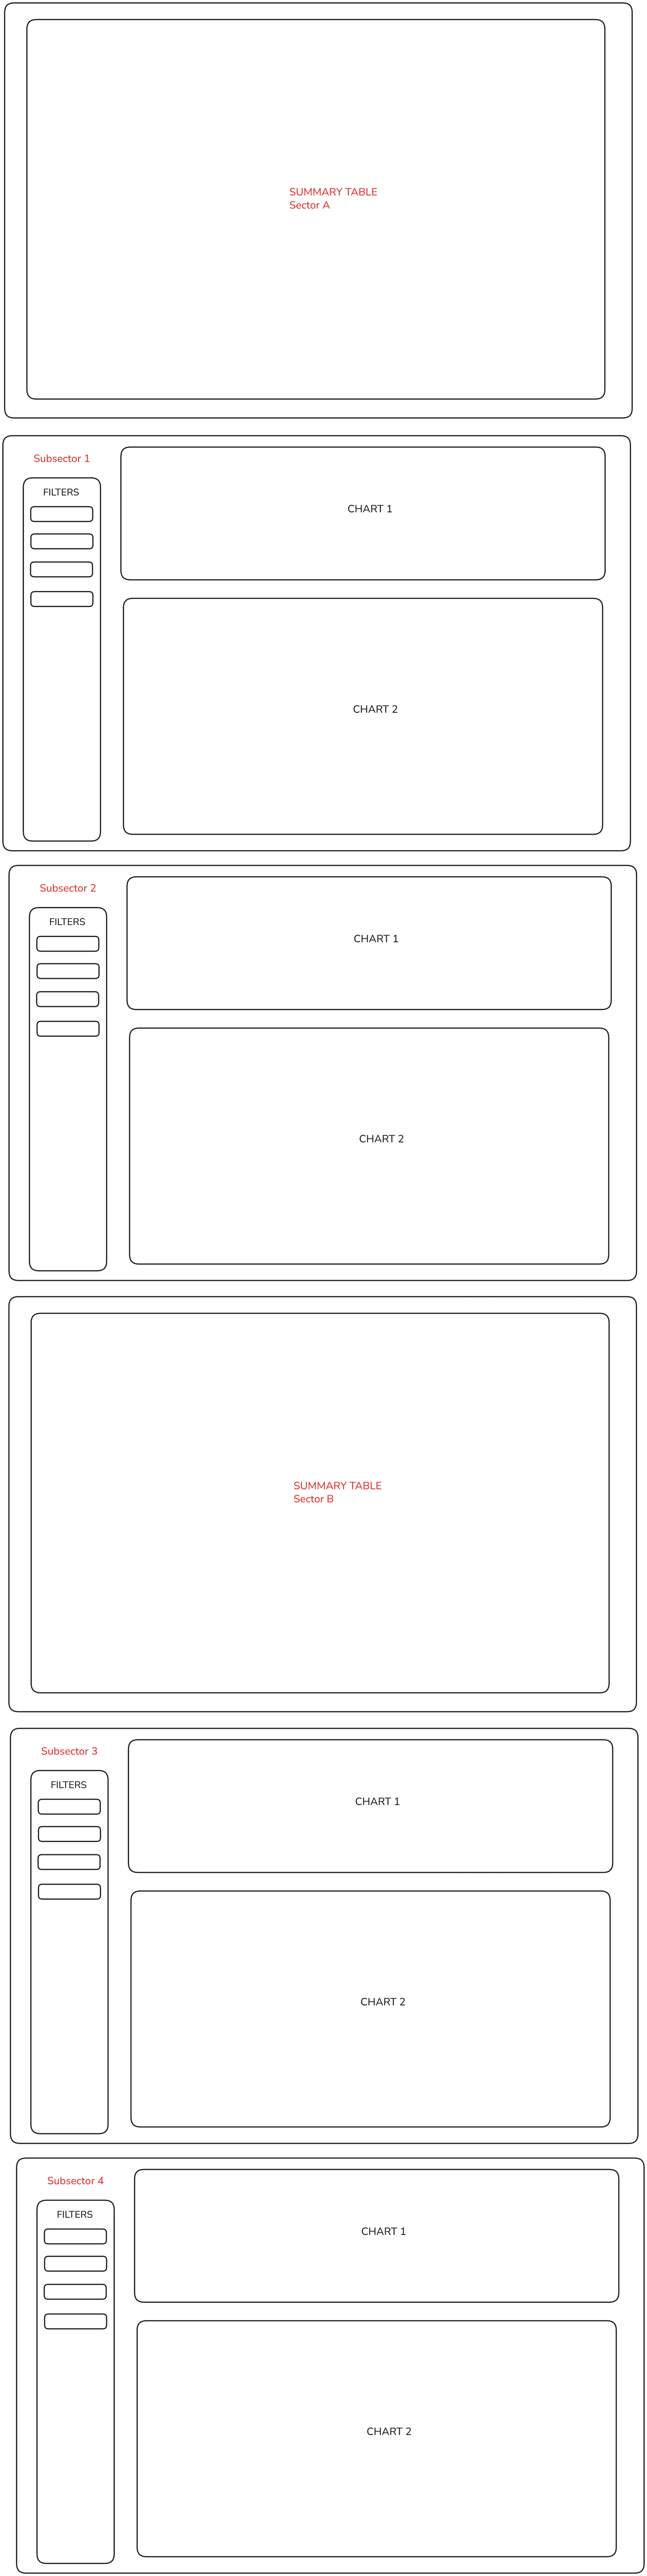
I had to experiment with different solutions until I found the right one. Eventually, I settled on using a recursive groupby function. If a user wanted to nest pages, they would pass in columns to group the stitch table by. In our example, we would have to pass in the columns 'Sector' and 'Subsector.' The recursive groupby re-arranges the order of the stitch table by the values in the columns (e.g., Sector A and B), effectively nesting pages in a hierarchy. The class still allows users to print static pages before and after the nested pages.
Caveats
The way in which I thought about and ultimately built my solution was informed by the way my client often designed their dashboards. My ideal scenario would have been to have my client engage the dashboards directly. I've had mixed success in this regard for a variety of reasons. In the meantime, I needed a way to easily generate PDFs from interactive dashboards. When I arrived at my client, they were creating workbooks with 40+ dashboards (each with 3-4 sheets) because they needed to be able to print different slices of views. With my solution, they are now able to consolidate workbooks into interactive views, and generate dozens of pages with the execution of one class. I pushed this function to production around the fall of last year (2025). Although I've had to perform minor refactors to handle some edge cases, by and large this solution has stood the test of time and has endured some complex PDF prints.
Because I am directly pulling the data source of the dashboard from Snowflake to help create view filters, it can be tricky when trying to configure a view with calculated fields. Although I have built in processes to handle situations like this, the process can break depending on the complexity of the dashboard. The rule of the game at my client is to keep dashboards as simple as possible to avoid having to create view filters based on calculated fields or parameters (I have created an entirely different process for cases like this, but that's for another blog). Fortunately, all business logic lives in python so there is rarely a need for new fields in Tableau, except for formatting or interactive purposes.
Overall, my python and understanding of Tableau's APIs vastly improved through this project. And I hope you took something away from this blog, too. I've left a lot of little details out, so if you are interested in learning more, feel to reach out!