Today was the first day of dashboard week, dun dun dun!
Our task today was to download water quality data from https://gemstat.org/data/data-portal/ – Andy copied and pasted his blog from Google Docs causing our blog-writing interface to blow up on him meaning we had from 8:53am to get it done.
Downloading the data was stressful – only 500 stations could be downloaded, some countries had 1000s, and we had to pick an entire continent!
Even by sticking to the rules we ran into difficulty. Some of us started writing emails, and I even tried to phone the German office. Then suddenly, at about 9:22am, the data came in!
Data Prep
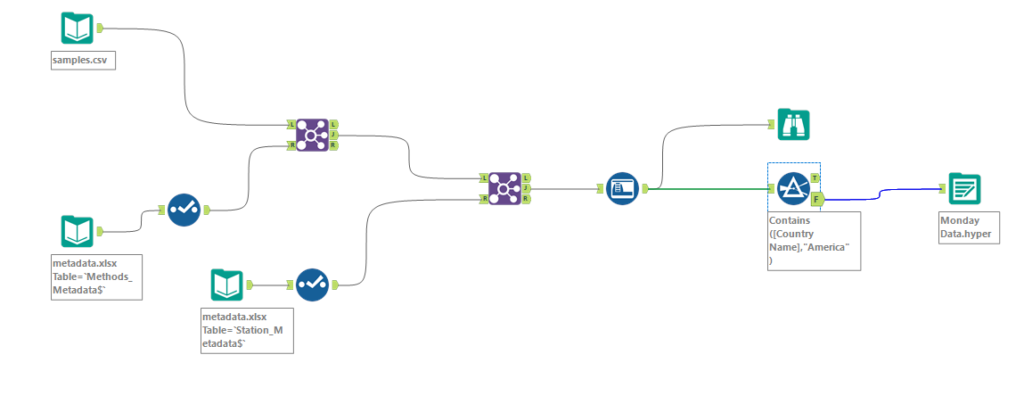
Luckily, today and probably only for today, the prep was relatively easy. All it meant was a few joins and sorting of data-types. It was tempting to play around and try to do more, but nothing more was strictly necessary given the deadline – consultants have to prioritise!
Viz Building
I ran into a little difficulty with my LODs today and had to call for help. The problem was that I wanted to compare the latest year’s figures to the previous year’s figures but as a BAN meaning that a table calc wasn’t on the cards.
What I needed to do was fix at the level of my parameters and turn my year into an integer in both my ‘max date’ calculation and my ‘value of max date’ calculation.
{FIXED [Parameter Long Name] :
MAX(YEAR([Sample Date]))}
IF YEAR([Sample Date]) = [Max Date] THEN [Value] END
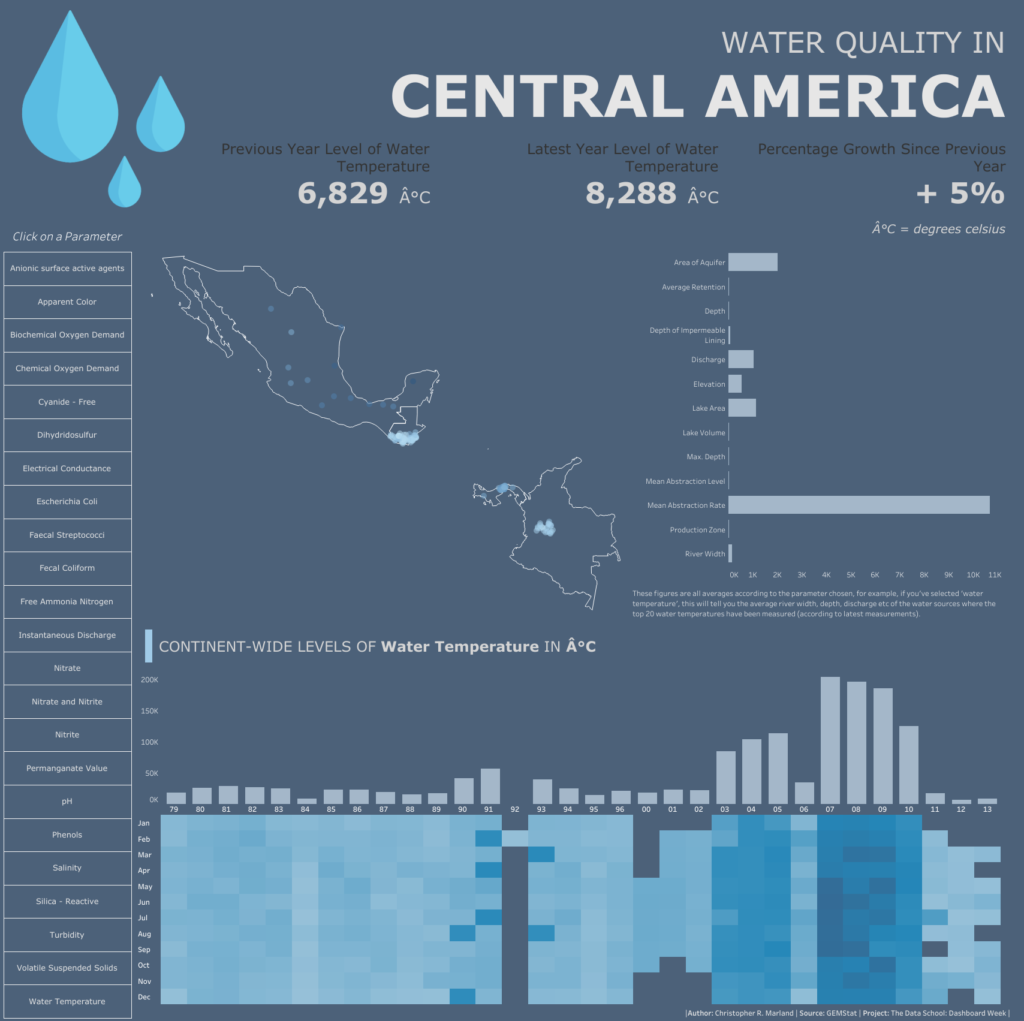
Once those calculation difficulties were over, it was just a simple task of chart building and design!
Et voila, here’s the finished product: