Our first project in Dashboard week comprised of analysing GEMstat water quality data. Each member of our cohort had to pick a continent and prepare and visualise the data.
We each had to request our chosen data from the GEMStat website and this took a while to come through to us via email. After a while researching the topic, the data arrived we were raring to prepare and visualise it!
The Data
The data was emailed to us in a zip folder and this included a help sheet on the meanings of the different codes and readings. Our data included a csv file with all the water sampling data as well as a separate Excel file which included information on the stations, parameters of water quality and the methods used.
Preparing the Data

I prepared the dataset to be visualised in Alteryx. This consisted of two main tasks:
- Parsing the samples csv into a tabular form. This was simply done with the Text to Columns tool in Alteryx.
- Decoding the samples csv (station codes, parameter codes and method codes) with a lot of joins to the various tables in the Excel file.
Along the way there was a little bit of general cleaning and I also created some spatial points to represent the different water monitoring stations so that they could be visually presented in Tableau.
The Challenges
Bringing the data into Tableau, I started by experimenting and creating a lot of different charts to see what insights I could find in the data. However, it soon became apparent that there were a great deal of gaps in the data. The dataset only included data from 9 different countries in Africa and most of these had big gaps in their reporting and few parameters that were monitored with any consistency.
These gaps in the data presented a big challenge with regard to the best way to visualise the data and where the best places to look for insights were. After considering this for a while, I realised that I couldn’t really take a geographical approach on station or country level and would have to find another approach to the data.
A different approach
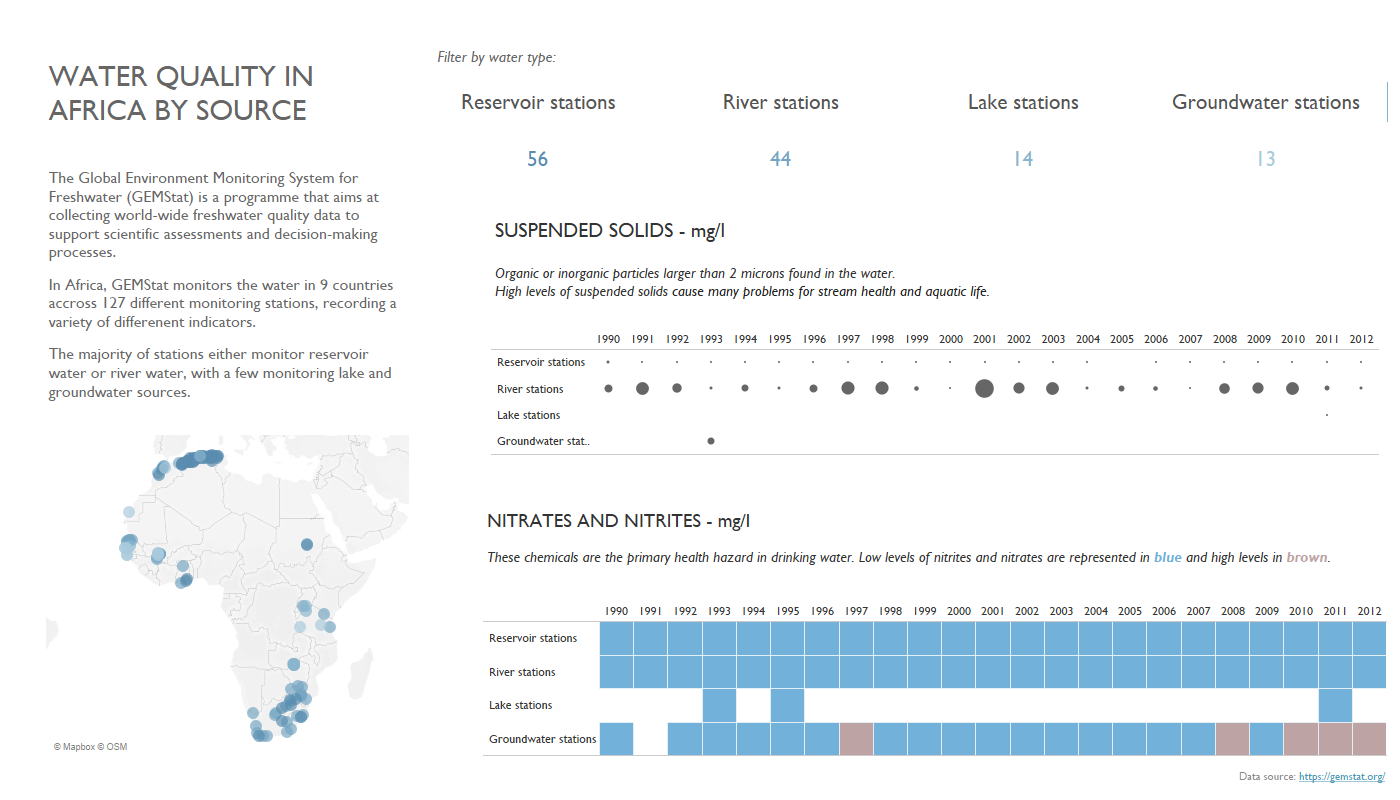
Looking back at the dataset, I could see that the water stations monitored water that fell into four main categories: reservoir, river, groundwater and lake. After experimenting with these dimensions, I could see that although there were still gaps in the data, these categories provided a more consistent view of the parameters and seemed to be a better prospect to visualise. Due to this, decided to look at how the different water types effected water different water quality parameters.
Looking at this sample data, the best highest quality water in Africa seems to be in reservoirs, which have both low levels of nitrates and nitrites and suspended solids.
Below is my final visualisation:

Link to visualisation here: https://public.tableau.com/views/DashboardWeek1/Dashboard1?:display_count=y&:origin=viz_share_link
