


A funny thing about digital data is its immateriality. It’s hard for my mind, at least, to discern the functional difference between kilobytes, megabytes, gigabytes and beyond. However, when you start working with this data, these differences become very, very important.
Acquiring the Data
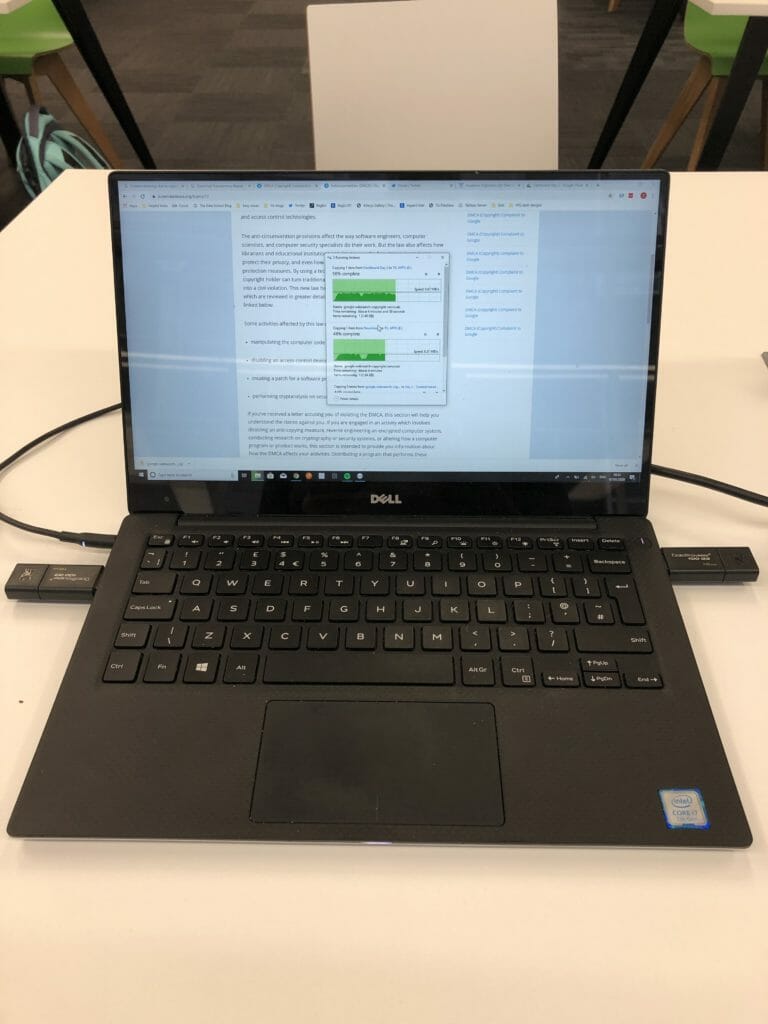
Such was the situation this morning when, despite Coach Andy’s admonitions to be picky about the amount data we were downloading, DS17 was faced with downloading a 3.6 GB data dump from Google’s transparency report. That’s the equivalent of about 13,000 200-page books. We tried to find an option to section off a portion of this data before downloading but there seemed to be only one big, blue download all report information. After a few of us started downloading the file, the bandwidth at the Data School offices dropped to approximately zero. Clearly, some teamwork would be required. As my file had come the furthest along, we decided to continue with my download and then purloin some USB drives from the storage closet to transfer it between laptops. I had never dual-wielded USB sticks in a computer before, but The Data School brings all sorts of opportunities.
By about 9:40 am everyone had their data. By 10:10 am, Andy was coming out to badger us about torpedoing the WiFi.
Preparing the Data
The transparency report from Google consisted of three csv files with data back to 2011. The data regards all requests made under Digital Millenium Copyright Act to de-list certain URLs from search due to copyright infringement. One file notes all of the takedown requests made to Google that Google acted on, another contains the domains that were targeted by takedown requests, a third contains all the takedown requests that Google did not act on.
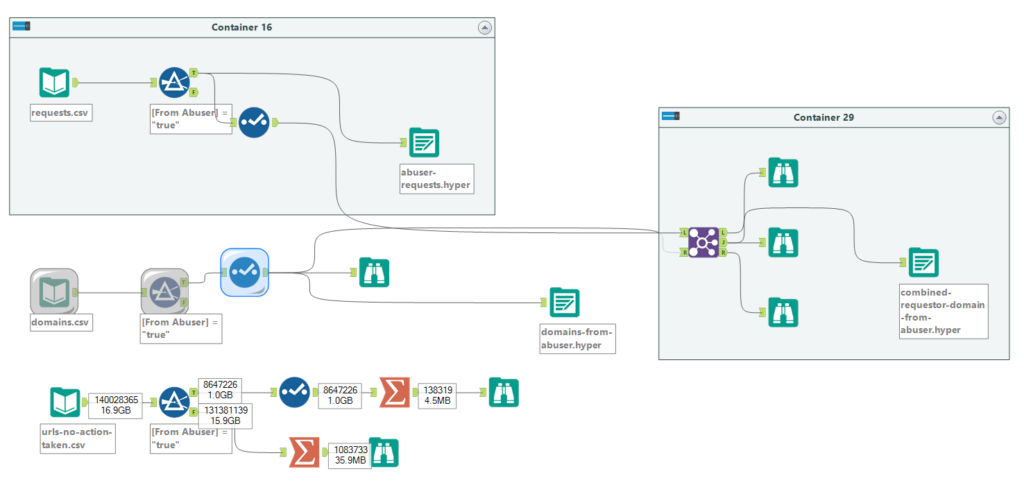
I brought the data into Alteryx for preparation to see what I might be able to cull quickly out of the millions of rows of data. One field I noted was a boolean (true/false) field that flagged whether Google considered the requester an abuser. Bingo! Using a filter, I found that using only data where the requester is considered an abuser brought the dataset down to a more management number of megabytes. I filtered the requester and domain CSV files down to just the requests flagged for abuse and then joined them together so I could see who was making fraudulent requests of who.
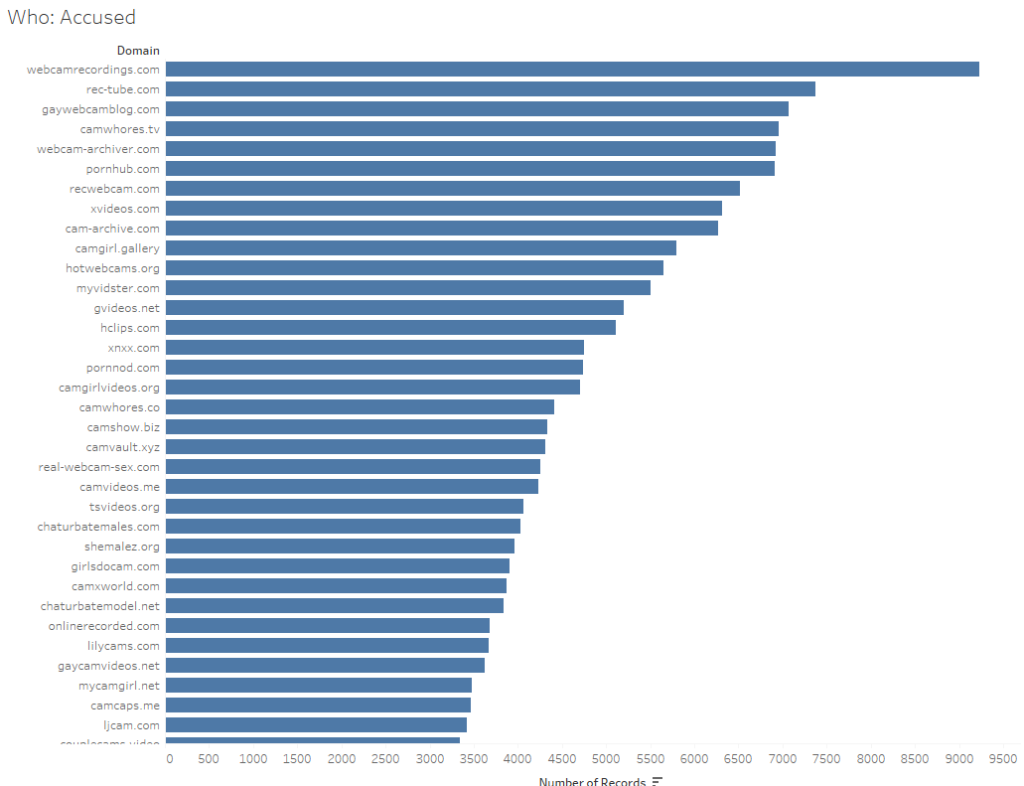
Parental Warning: The following images and visualisations may contain graphic domain names. Proceed with caution.
Scoping the viz
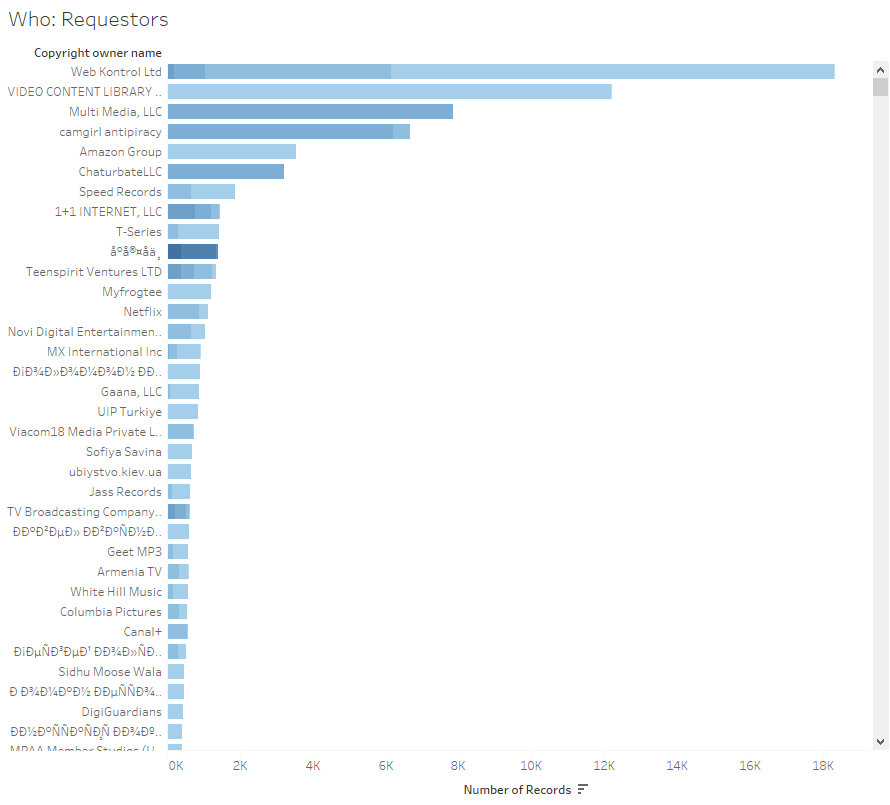
I started asking the who, what, when questions that help lead to insights.
Insight 1: Turns out the world of abusive content takedowns is full of pornographic websites, lots of them. The requesters were pornographic, the targeted domains were pornographic. Occasionally, there’d be a humorous name like “Dogfart Network” but that was overwhelmed by the number of camgirl sites (and others that you can explore my viz for).
Insight 2: The number of requests marked abusive seems to be increasing in both real and relative amounts.
I figured that between these two insights, I could build a decent dashboard. For design inspiration, I took Josh Tapley’s fantastic viz for the Cerebro Project on Tableau Public users.
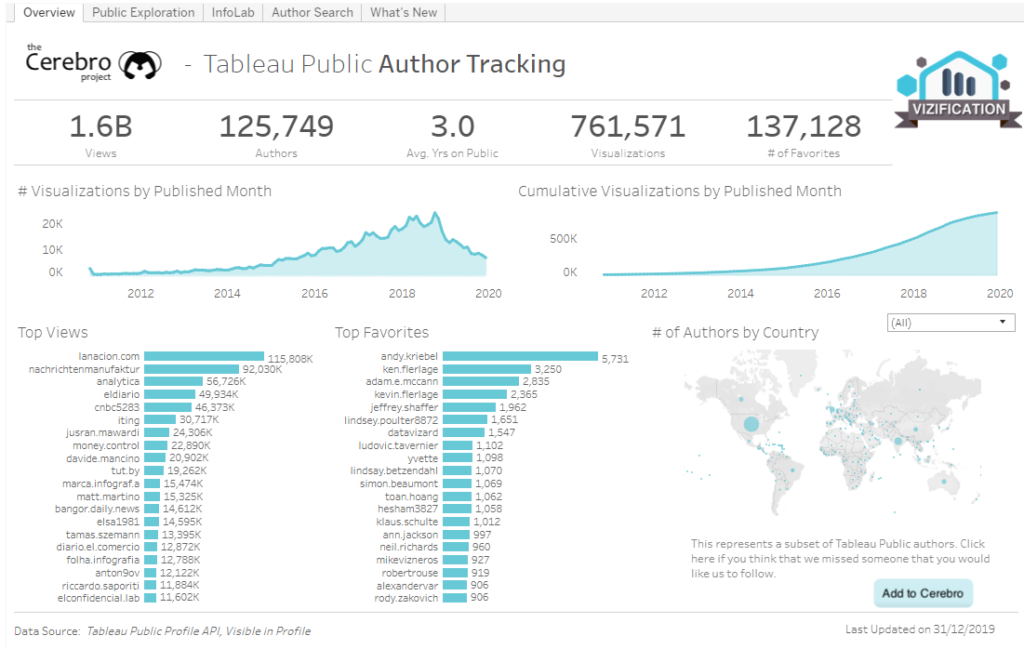
I liked that this viz combined some nice BANs, line charts for change over time as well as lots of names. I had the potential for all of these elements in my data as well.
Making the Viz
Based on Josh’s viz, I made a pen and ink sketch of the viz I wanted to build.
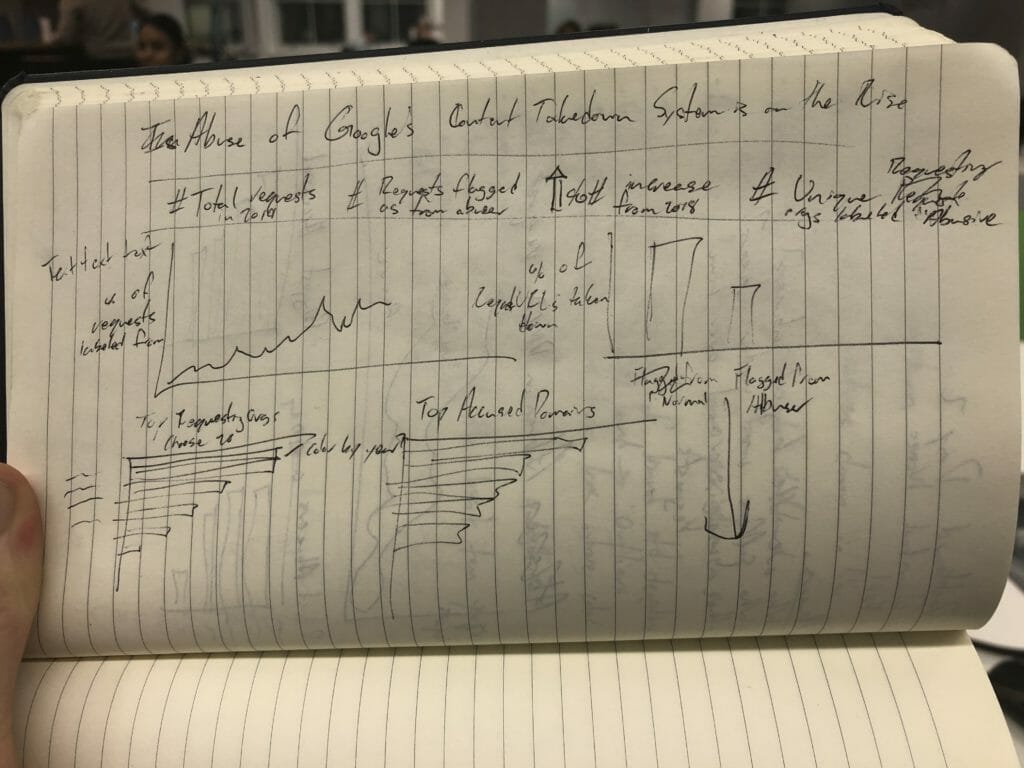
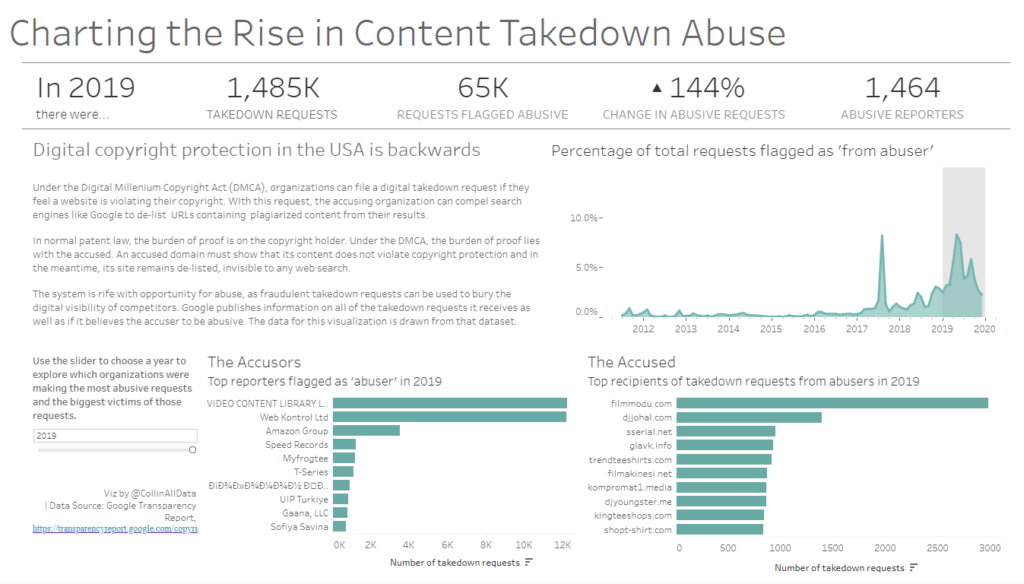
I wanted to highlight both the increase in abusive requests over time and show the top requesters marked as abusive and the top domains that were flagged by abusers for copyright issues.
After my sketch was finished, I built a wireframe dashboard with layout containers in Tableau, following data schooler Joe Beavens’ method.
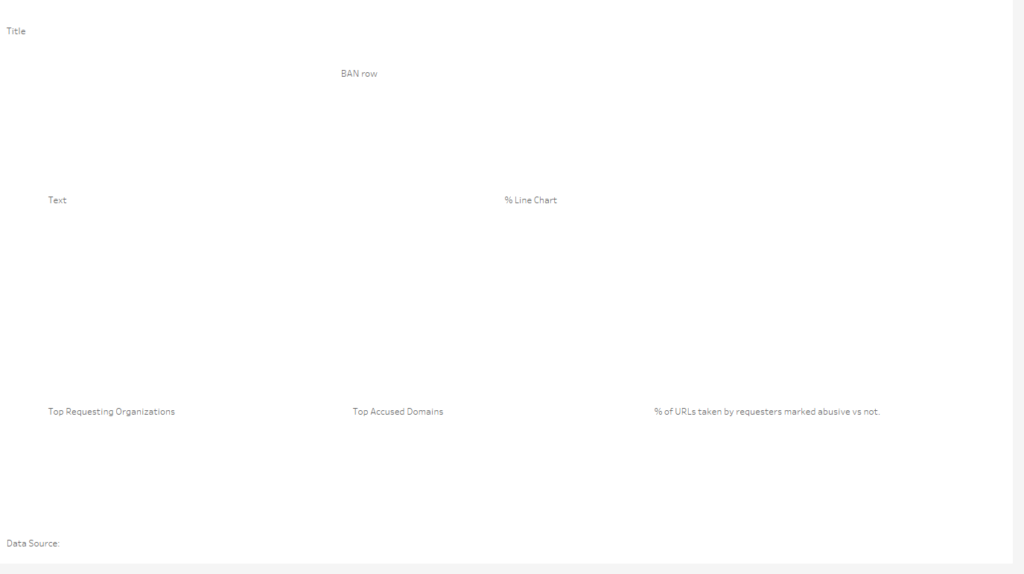
I often get dinged in viz reviews for lacking some BANs (or Big-Ass Number for the laymen) in my viz that help give the reader a quick understanding of the viz as a whole. I wanted to make sure that I included a variety of BANs in this viz.
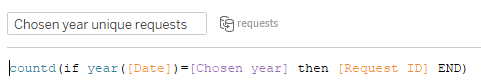
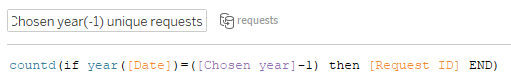
As I was building the viz out, I realised it would be handy to show data on a year by year basis. I accomplished this by creating a year parameter and a filter based on that parameter. This let me do nifty things like create create a calculation for year over year growth based on any particular year. Perfect for an adjustable BAN!
Thinking about the flow of my viz, I wanted the reader to digest the numbers and meaning for 2019 first, so I put the parameter adjuster towards the bottom. I also included quite a bit of explanatory text, as the world of digital intellectual property law isn’t so easy to understand. I felt the text was justified given the complexity of the topic.
The Final Product
A bit of a bumpy start today led to some unique solutions among the DS17 team. I’m looking forward to seeing what everyone else produces!