Hey Tableau universe! This is the first of what will be a series of short blogs on visual cues in Tableau that are easy to miss but a great help once you realize what they are trying to tell you. Today, the hidden meaning in the continuous field filter. Why are there different colors? What do they mean??

Short answer: The dark gray area indicates the range of the field that is actually in the chart view. The medium gray area between the handles (semi-circles) shows the extent of the filter range beyond the extent of the field range within the filter. The entire bar shows the full range of the field.
Confused? Want to know more? Read on to the long answer…
Playing with filters

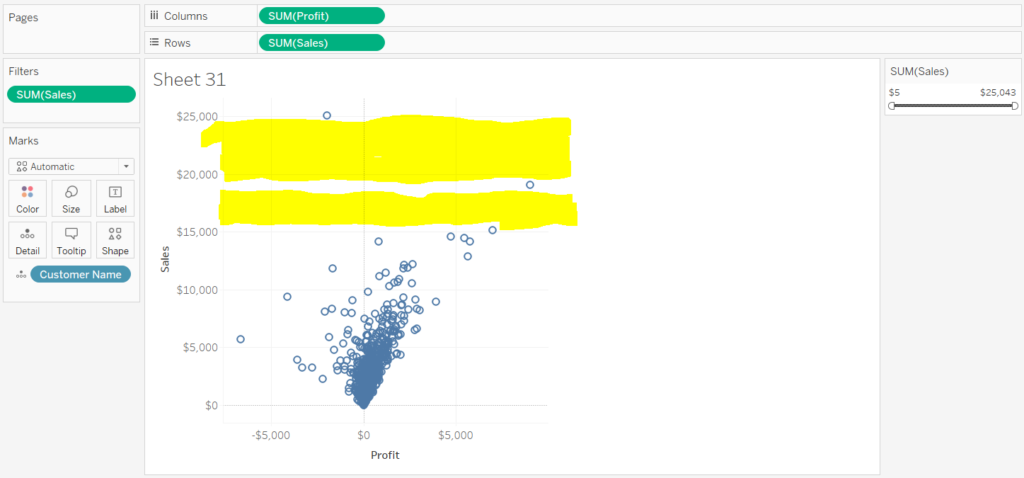
Notice how in this scatter plot, there is a range of sum([Sales]) highlighted in yellow where no records exist. There appear to be no values between roughly $15,500 and $18,500 and between $20,000 and $25,000.
If we create a continuous value filter on sum([SALES]) and include the entire range of sum([Sales]), it looks like this on the filter card:

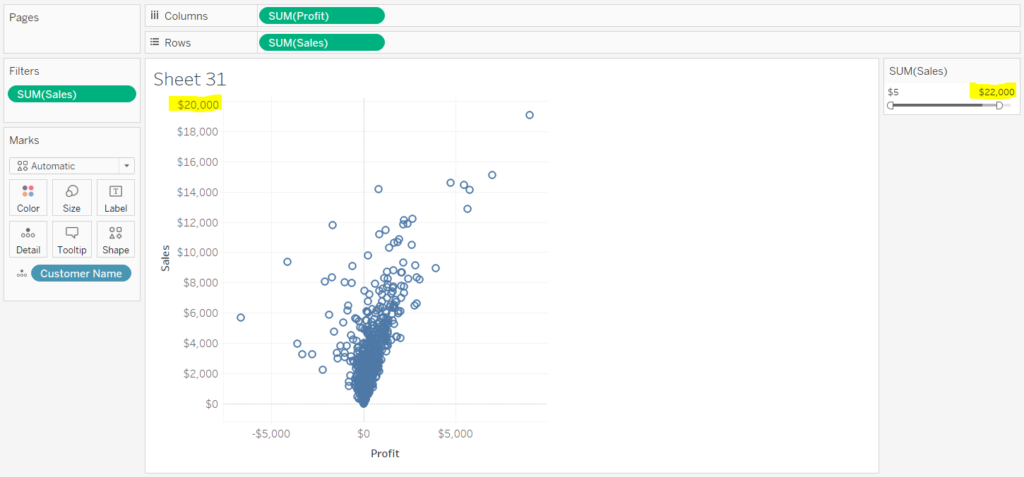
Notice how the whole bar has a dark grey color. If we set the range to between $5 and $22,000, our chart and filter look like this…


Look at the discrepancy between the value on the top of the axis for sum([Sales]) ($20,000) and the end of the filter ($22,000).
Tableau is automatically generating an axis that contains all the marks within the filter, sizing it to extend just beyond the last value for which a record exists. To let you know that the visible axis does not extend to the end of the filter, Tableau shows the area in the filter that is not contained in the chart in a medium gray color. It shows the values in the entire field range that are not contained in the filter in a light gray.
In summary:
Dark gray: Data range in the chart
Medium gray: Data range in the filter but not in the chart
Light gray: The full data range of the field
Note that the same principles described above for continuous filters apply equally for dates formatted as continuous fields.
