


For the third day of dashboard work, we were tasked with web-scrapping the Bundesliga League’s website. 1. Bundesliga is a professional association league in Germany with a football competition that allows 18 teams to compete with teams from 2. Bundesliga in a system of promotion and relegation. The data was a table that had 18 teams and their stats for a season. These stats included their wins, draws, losses, goals, differences between the # of times a team scored a goal or conceded a goal, and the total points they earned. One of the requirements for this challenge was to get data from at least 20 seasons so I got data from seasons 2020-2023.
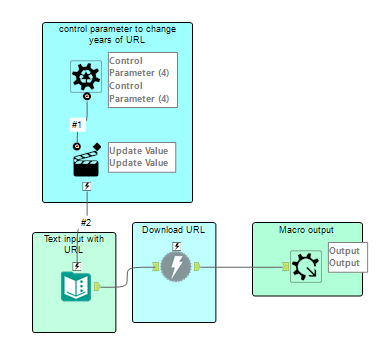
I forgot how to scrap a website so getting the data took longer than I wanted it to. I also had to generate a batch macro to extract all the seasons. Although the process was strenuous, I was happy I was able to get the data and practice using batch macros in Alteryx.
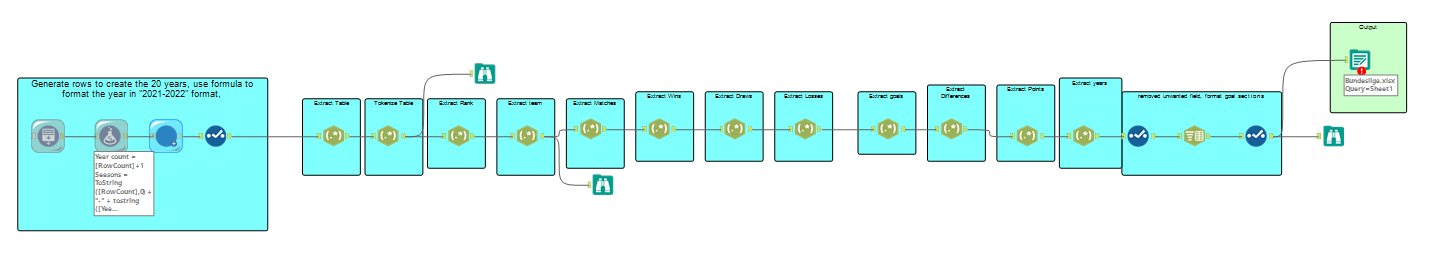
Here’s my Alteryx workflow:
For the dashboard, I wanted to create charts that will reveal bigger trends in German football so I focused on these questions:
- Does the # of times they concede a goal or earn a goal impact their participation in the Bundesliga?
- Points, rank, and performance over time
- What’s the Goldilocks zone for winning and losing?
Here’s the dashboard:
