It’s often useful for a user to be able to see data at a high level, with the option to dive deeper into certain areas if required. A drill into bar chart can be the perfect way to achieve this, letting the user choose the level of detail they require, without overloading the view.
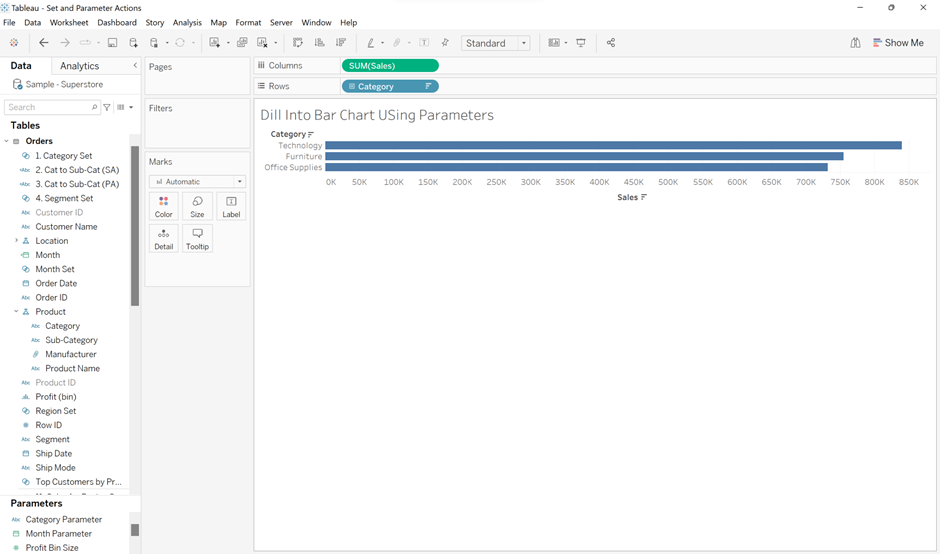
Let’s look at an example from the Superstore dataset. As an overview, we want to see the total sales for each category of products the store sells. We also want the option to see the sales for each category broken down into individual sub-categories.
To start, drag the sales onto columns and category onto rows and sort by descending sales. We now have the high-level comparison between the total sales for each category that we wanted.
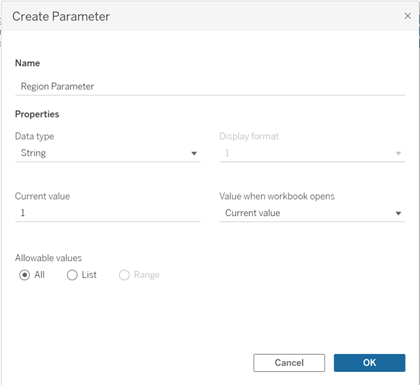
In order to drill into each category further we must create a parameter. Click the arrow at the top of the data pane and select Create Parameter. As we are wanting to select a category within this parameter, we want the data type to be a string. Leave Display Format as it is and Current Value can be left as 1, or changed to match a category name. Note that when stating a current value the category name must be spelled correctly and must be case correct. Leave Allowable values as all and remember to name the parameter something suitable.
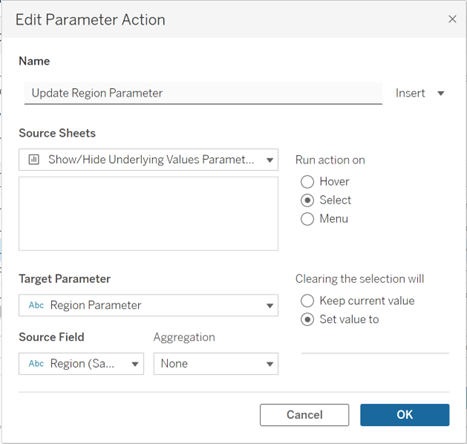
Right-click the newly created parameter in the Parameters section of the data pane and select show parameter. Now we need to create a parameter action in order to change the parameter when we select a category in our chart. Click workbook in the top tab of Tableau and select actions. Click Add Action and select Change Parameter. In the Edit Parameter Action window ensure that the source sheet is the sheet containing the chart you’re working on. Choose the Run action on as Select and the Clearing the selection will as Set value to with the box below left empty. This will mean that our parameter will be updated when the chosen category is clicked and that when it is unclicked the selection will be cleared so that no categories are selected. Set the Target Parameter to the Region Parameter we just created and set the Source Field to Region. Now when you select a category on the chart, the parameter should update accordingly.
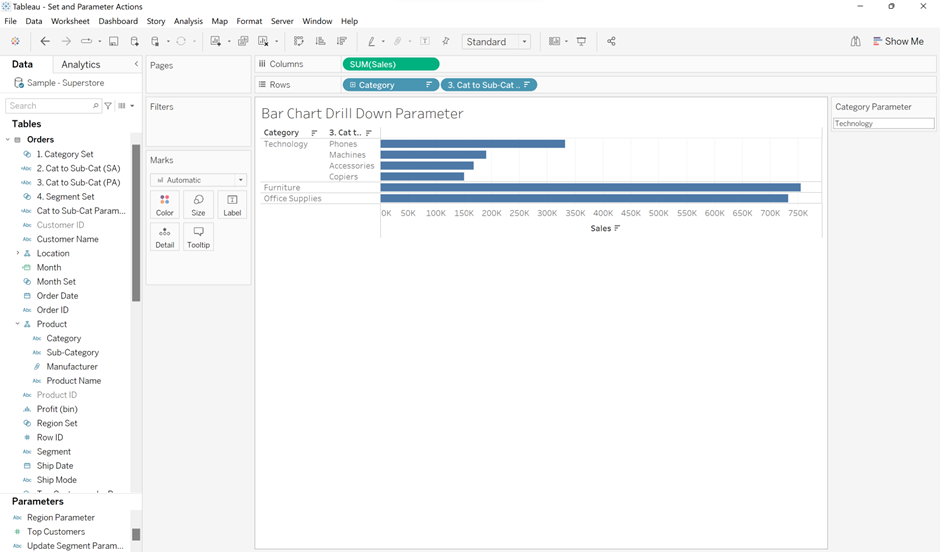
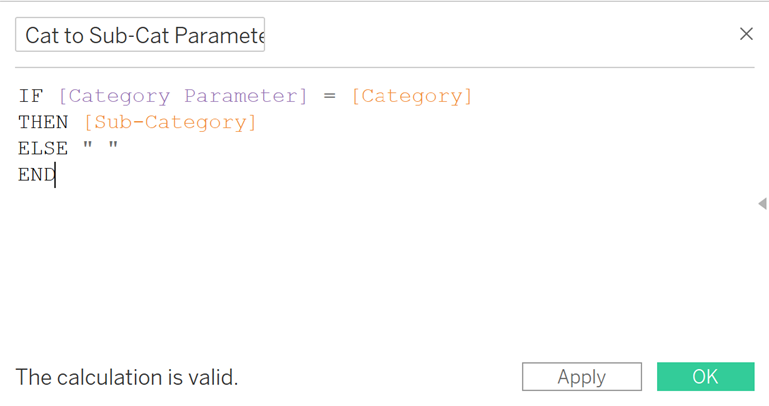
Lastly, we need a calculated field to say that when our Category Parameter is selected, the corresponding subcategories are expanded. For all other categories, we want nothing. The following IF statement provides this. Drag the calculated field onto rows tab and ensure to sort by descending.
You should now have a drill-down bar chart that allows you to select categories in order to show additional bar charts for the corresponding sub-categories. When deselected, only the categories should be in view.